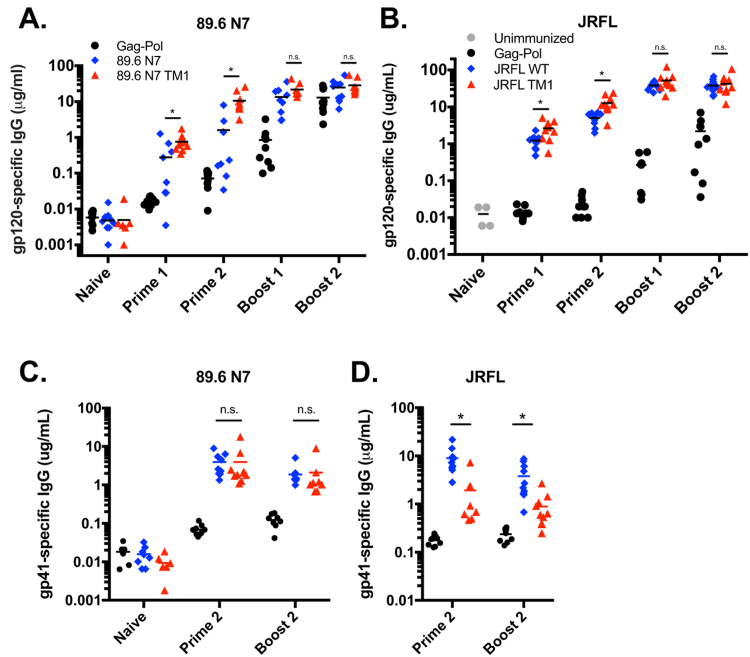
Fig S3.
Distribution of gp120- and gp41-specific IgG responses. The data reflect the same assays shown in Fig. 5 but gp120-specific IgG (A, B) and gp41-specific IgG (C, D) is shown for individual mice in (A, C) 89.6 N7 and (B,D) JRFL immunizations. Horizontal bars indicate the mean. Separate unimmunized mice were used as negative controls in (B). Asterisks denote a significant difference (p < 0.05) between WT CT and TM1 groups by one-way ANOVA with Tukey's test on log-transformed data.

