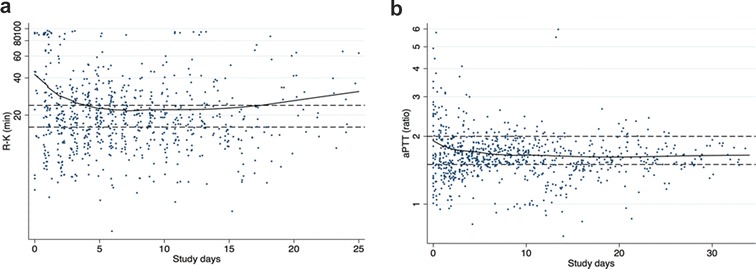
Fig. 3.

aPTT ratio and R-K values during study days in patients randomized to the aPTT group (panel A) and to the TEG group (panel B). Lines are lowess smoothing. Reference lines: 1.5–2 for the aPTT ratio and 16–24 min for the R time. 56.5% of the analysis was in range in the aPTT group compared to 29.8% in the TEG group (p < 0.001). aPTT activated partial thromboplastin time ratio, R-K TEG reaction time, TEG thromboelastography
