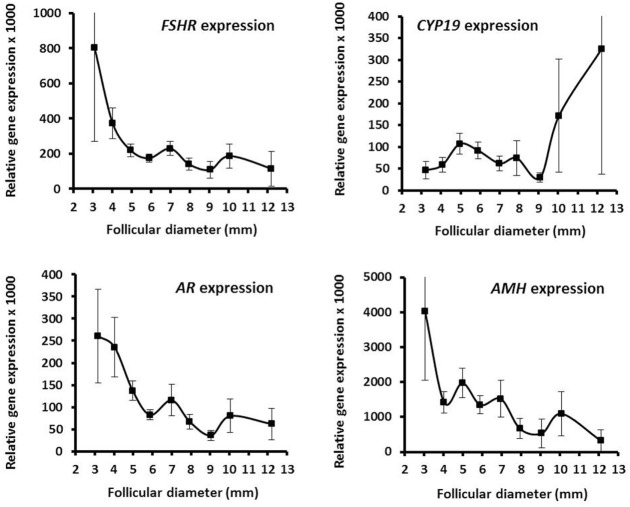
Figure 3.
Granulosa cell expression of selected genes in human small antral follicles. Graphs show relative expression levels of FSHR, CYP19a1, AR, and AMH in relation to follicular diameter. Values are presented as mean ± SEM. Statistically significant differences were observed in the mRNA expression levels of FSHR [analysis of variance (ANOVA); N = 315; P < 0.002] and AR (ANOVA; N = 316; P < 0.03), but not for CYP19a1 (ANOVA; N = 252; P > 0.10) and AMH (ANOVA; N = 277; P > 0.10). Specific numbers for the analyzed follicle groups divided according to follicular diameter are shown in Table S3 in Supplementary Material.

