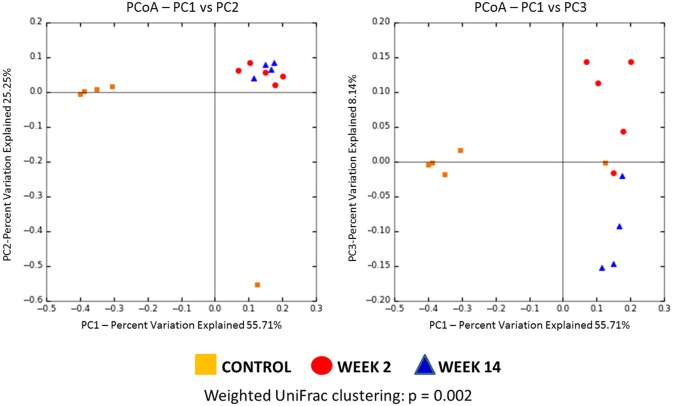
Figure 6.
Principal coordinate analysis (PCoA) plot of the microbiome from three groups (Control, Week 2, and Week 14) using weighted UniFrac clustering (Control = Orange, Week 2 = Red, Week 14 = Blue). Using weighted UniFrac clustering, significant differences in beta diversity were found among three groups (p = 0.002).

