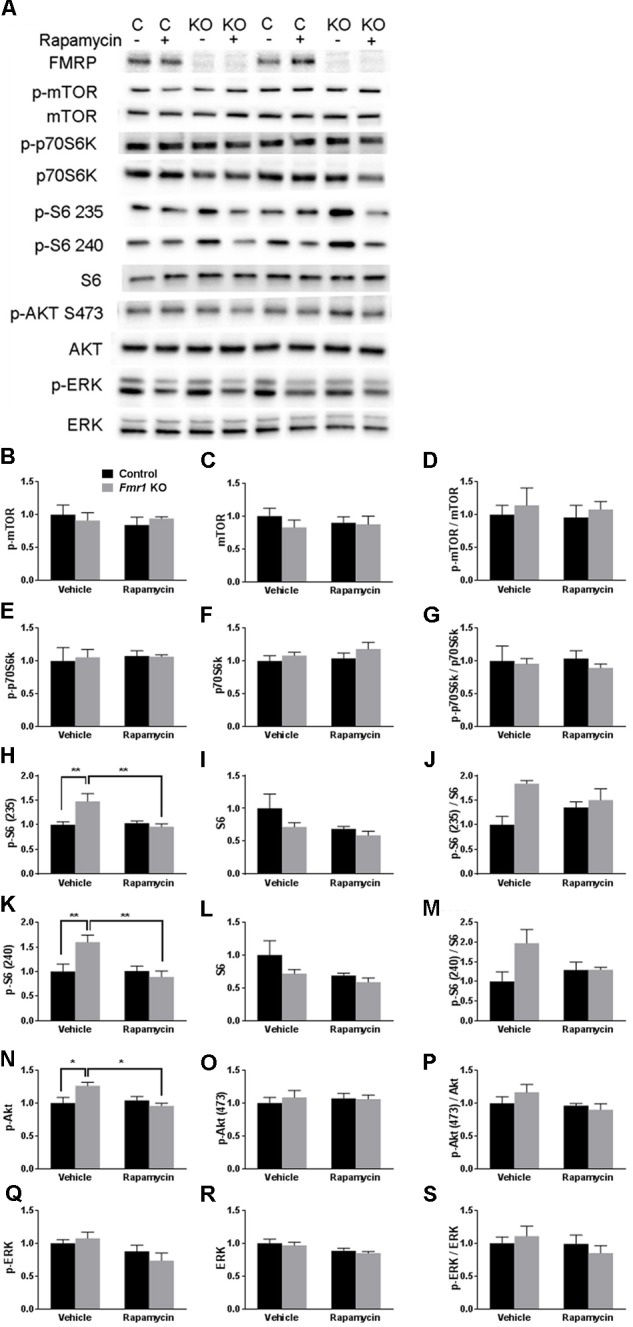
FIGURE 1.

Westerns blots of frontal cortex of Fmr1 KO and control mice on vehicle and rapamycin treatment. (A) Representative Western blot images. (B) p-mTOR levels did not differ among the groups. (C) mTOR levels did not differ among the groups. (D) p-mTOR/Total mTOR did not differ among the groups. (E) p-p70S6k did not differ among the groups. (F) p70S6k did not differ among the groups. (G) p-p70S6k/Total p70S6k did not differ among the groups. (H) The genotype × treatment interaction for pS6 235/236 was statistically significant. Post hoc t-tests revealed that vehicle-treated Fmr1 KO animals had significantly higher p-S6 235/236 (p = 0.002) compared to vehicle-treated controls. This was significantly reduced by rapamycin treatment (p = 0.002). (I) S6 levels did not differ among groups. (J) The genotype × treatment interaction for p-S6 (235/236)/Total S6 approached statistical significance. We looked at individual differences by means of post hoc t-tests and found that the difference between vehicle-treated controls and vehicle-treated Fmr1 KO mice was statistically significant (p = 0.004). (K) The genotype × treatment interaction for p-S6 240/244 was statistically significant. (Post hoc t-tests revealed that vehicle-treated Fmr1 KO animals had significantly higher p-S6 240/244 levels compared to vehicle-treated controls (p = 0.010). This was significantly reduced with rapamycin treatment (p = 0.006). (L) Total S6 levels did not differ among the groups. (M) The genotype × treatment interaction for p-S6 (240/244)/Total S6 approached statistical significance. We looked at individual differences by means of post hoc t-tests and found that the difference between vehicle-treated controls and vehicle-treated Fmr1 KO mice was statistically significant (p = 0.016). (N) The genotype × treatment interaction for p-AKT Ser473 was statistically significant. Post hoc t-tests revealed that vehicle-treated Fmr1 KO animals had higher p-AKT compared to vehicle-treated controls (p = 0.020). p-AKT Ser473 levels were reduced in Fmr1 KO animals after rapamycin treatment (p = 0.013). (O) Total AKT levels did not differ among the groups. (P) p-Akt (473)/Akt did not differ among the groups. (Q) The main effect of treatment for p-ERK levels was statistically significant indicating that regardless of genotype, rapamycin reduced p-ERK. (R) The main effect of treatment for ERK levels was statistically significant indicating that regardless of genotype, rapamycin reduced ERK. (S) p-ERK/ERK did not differ among the groups. (B–S) Levels were normalized to total protein in the blot. Values presented are relative to the mean of vehicle-treated control values. Bars represent mean ± SEM. ∼0.05 < p ≤ 0.1, ∗0.01 ≤ p ≤ 0.05, ∗∗0.001 ≤ p ≤ 0.01 as determined by post hoc t-tests. n = 4 vehicle-treated control, n = 4 rapamycin-treated control, n = 3 vehicle-treated Fmr1 KO, n = 3 rapamycin-treated Fmr1 KO.)
