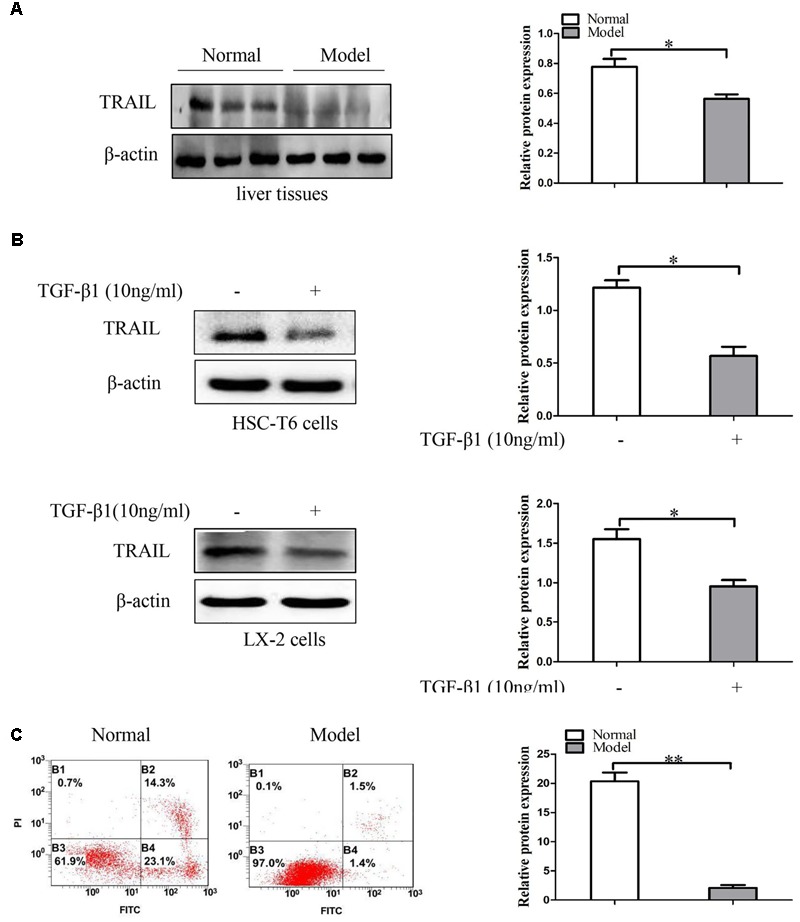
FIGURE 2.

The expression of TRAIL in liver fibrosis tissues and TGF-β1-treated HSCs. (A) Western blot analysis and quantitative data for TRAIL expression in liver fibrosis tissues, β-actin as the loading control. (B) Western blot analysis and quantitative data show TRAIL expression in HSC-T6 cells and LX-2 cells treated with TGF-β1 (10 ng/ml) for 24 h. (C) The apoptotic rate of primary HSCs were determine by flow cytometry. The assays were performed at least three times with similar results. Data are shown as the mean ± SD (n = 3) of one representative experiment. ∗p < 0.05, ∗∗p < 0.01 versus normal groups.
