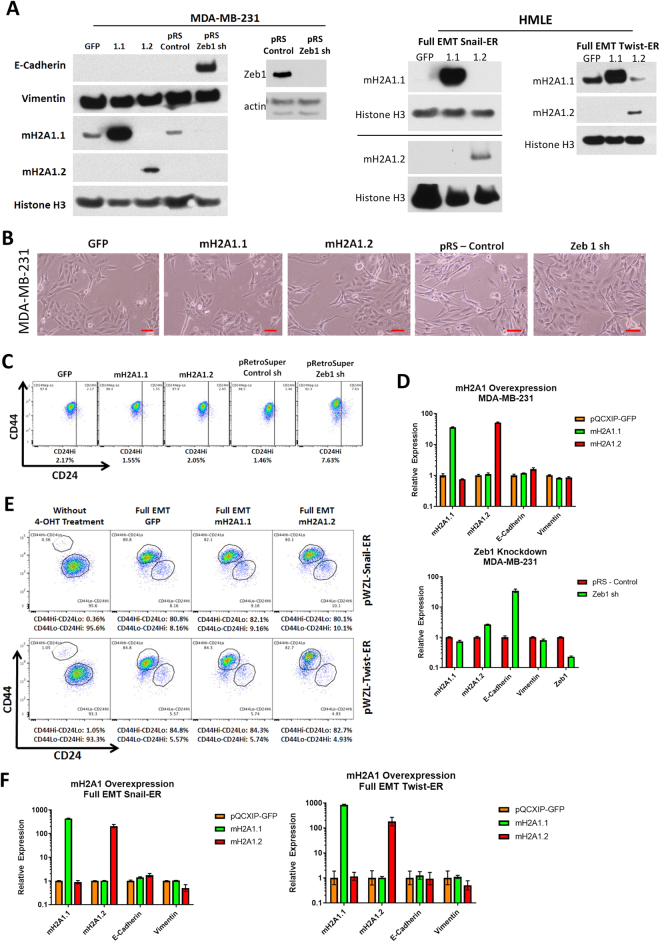
Figure 4.
(A) Western blot analysis of expression of MDA-MB-231, HMLE-Snail-ER and HMLE-Twist-ER cells transduced by the indicated vectors. Histone H3 was used as a loading control. (B) Phase contrast of MDA-MB-231 cells overexpressing macroH2A1.1, macroH2A1.2 or Zeb1 shRNA. Scale bar = 100 μm. (C) Flow cytometric analysis of cell-surface markers, CD44 and CD24, in the cells described in (B). (D) Relative expression of the mRNAs encoding macroH2A1.1, macroH2A1.2, E-cadherin, vimentin, and Zeb1 in the cells described in (B) as determined by real-time RT-PCR. Normalized to GAPDH mRNA to account for variability in template loading. (E) Flow cytometric analysis of cell-surface markers, CD44 and CD24, in fully mesenchymal HMLE-Snail-ER or HMLE-Twist-ER cells overexpressing macroH2A1.1, macroH2A1.2 or the control vector. (F) Relative expression of the mRNAs encoding macroH2A1.1, macroH2A1.2, E-cadherin, vimentin, and Zeb1 in the cells described in (E) as determined by real-time RT-PCR. Normalized to GAPDH mRNA to account for variability in template loading.

