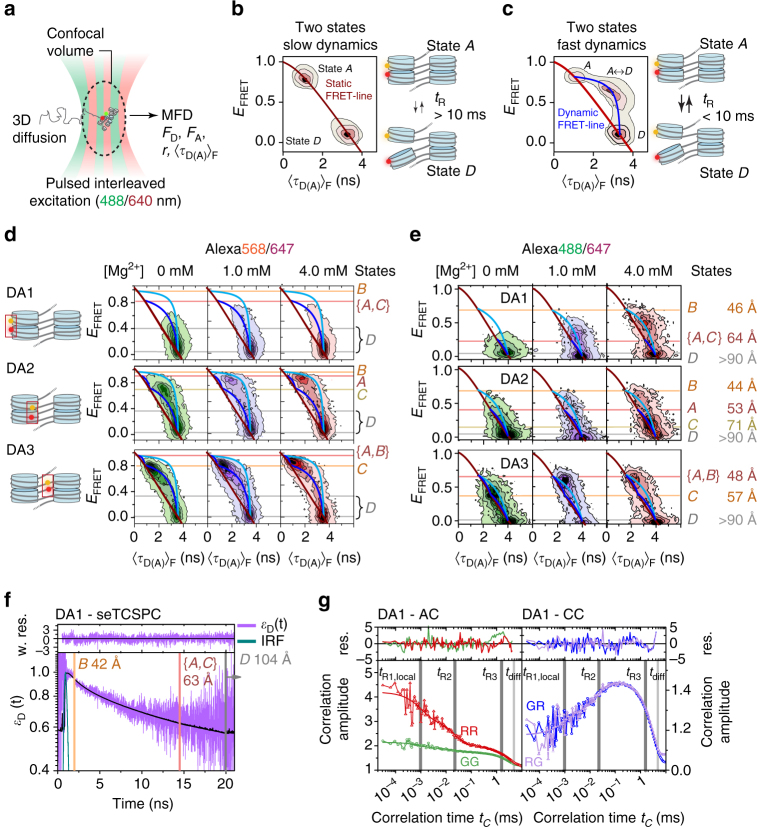
Fig. 3.
Multiscale chromatin dynamics in two registers revealed by MFD. a Scheme of PIE-MFD: Species-averaged donor and acceptor emission intensities (FD, FA), intensity-averaged donor lifetime 〈τD(A)〉F and anisotropy (r) are simultaneously measured for each molecule diffusing through the confocal volume. b Principle of MFD analysis: If dynamics between two states A and D are slow (relaxation time tR ≫ 10 ms), distinct structural states are resolved by EFRET and 〈τD(A)〉F, falling on the static FRET line (red). c Fast dynamics (tR < 10 ms) result in an intermediate peak (labeled A ↔ D) on a dynamic FRET line (blue). Peak shape analysis reveals tR (Fig. 5). d 2D-MFD histograms for chromatin fibers DA1–3 (Alexa568/647) at indicated Mg2+ concentrations. These histograms contain contributions from donor-only labeled chromatin fibers. Red line: static FRET line. Dark and bright blue lines: Two dynamic FRET lines for the two tetranucleosome registers 1 and 2, indicating dynamic exchange with tR < 10 ms (for parameters of all FRET lines, see Supplementary Note, step 2). Red, orange, yellow, and gray lines: FRET species A–D (see also Fig. 4a). e 2D-MFD histograms for chromatin fibers DA1–3 labeled with Alexa488/647 at indicated Mg2+ concentrations. Red line: static FRET line; dark and bright blue lines: dynamic FRET lines. f Subensemble fluorescence lifetime analysis for DA1-labeled fibers (Alexa488/647) at 1 mM MgCl2 and EFRET>0.065. The FRET-induced donor decay εD(t) was fitted with contributions from FRET species {A, C}, B and D (for details and fit parameters of eqs. 3.1–6, see Supplementary Note, step 3), corresponding to the indicated inter-dye distances. IRF: instrument response function. g Auto- (left panel) and cross (right panel)-correlation functions of the donor (G) and acceptor (R) emission channels for the same subensemble as in f. Global analysis of FCS curves reveals FRET dynamics with two global structural relaxation times (tR2 = 27 µs (27%); tR3 = 3.1 ms (56 %)), a term describing local fluctuations (tR1,local = 2.6 µs (17%)) and an apparent diffusion time for all curves (tdiff = 4.96 ms) (for details and fit parameters of Eq. 4.1, see Supplementary Note, step 4)

