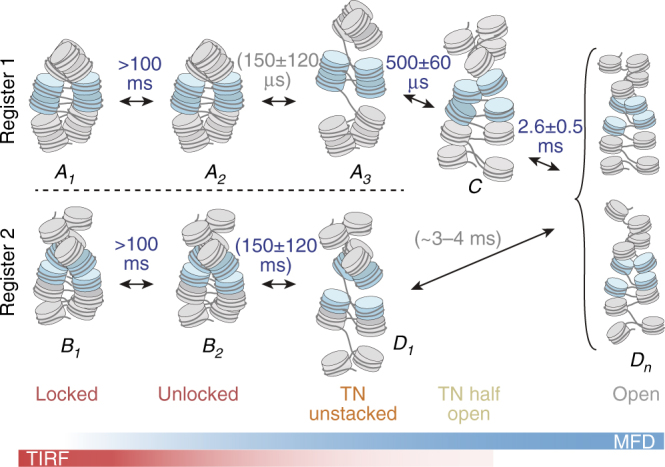
Fig. 6.

The dynamic register model of chromatin fiber dynamics (for details see text). The colored bars indicate the sensitivities of the two applied smFRET methods. The letters A, B, C, and D correspond to observed FRET species (Fig. 4a). Nucleosomes highlighted in blue are labeled and thus observed in the experiment. Numbered states correspond to different chromatin conformations, which exhibit the same FRET efficiency for DA1–3 but which can be kinetically differentiated. FRET species A includes conformational states {A1, A2, A3} for which stacked nucleosomes are observed. FRET species B includes all states {B1, B2} corresponding to observation across two neighboring tetranucleosome units. FRET species D (low-FRET states) includes locally unstacked nucleosomes (D1) and the ensemble of open fibers (Dn). Gray relaxation time constants are indirectly inferred; blue relaxation times are directly observed. The error ranges represent s.d. between observations of the same dynamic process with different FRET label pairs (for B2 ↔ D1), or directly from PDA subsampling (Fig. 5)
