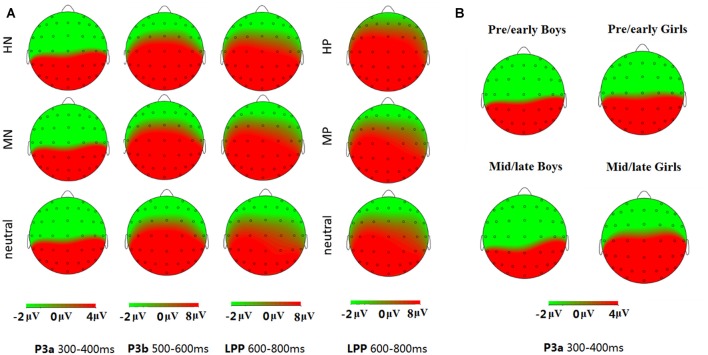
Figure 3.
Topographical maps of the voltage amplitudes elicited by different stimulus categories in P3a (300–400 ms), P3b (500–600 ms) and late positive potential (LPP; 600–800 ms) time interval (A); and topographical maps of the voltage amplitudes for the negative block in the P3a (300–400 ms) time interval for each group (B).

