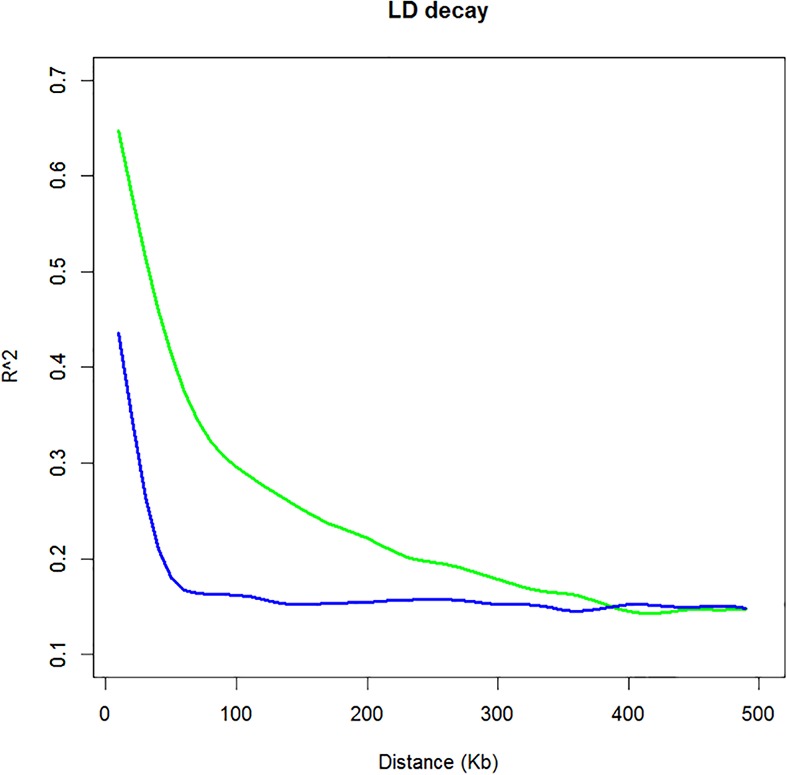
FIGURE 2.

Linkage disequilibrium (LD) graph of cultivated and wild mungbean. LD is determined by squared correlations of allele frequencies (r2) against distance between polymorphic sites, color-coded as follows: cultivated accessions (green) and wild accessions (blue).
