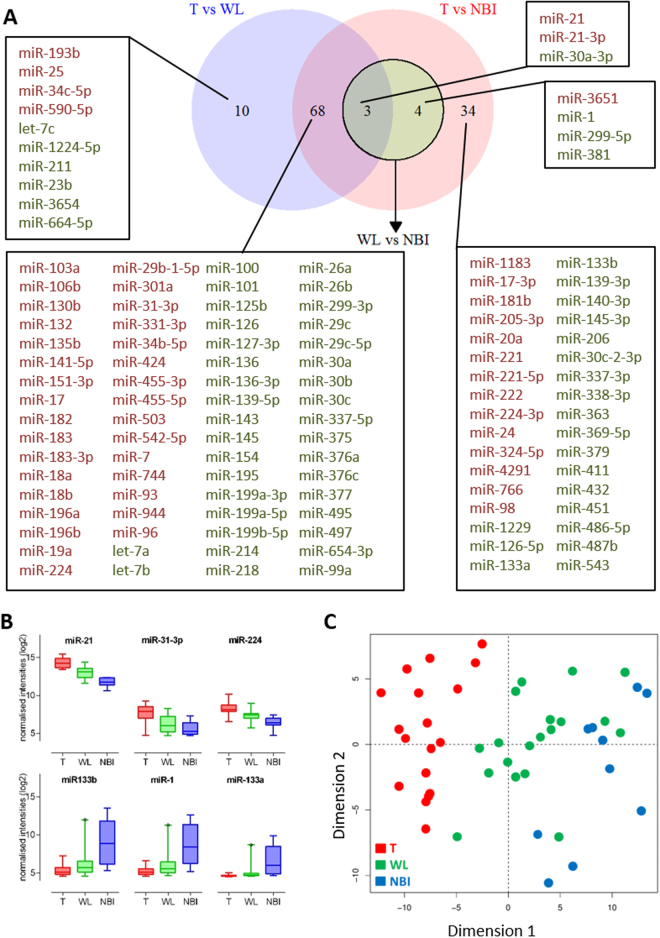
Figure 2.
Differential miRNA expression in OSCC margins. (A) Venn diagram illustrating the relationship between differentially expressed miRNAs in the three discrete comparisons: T vs WL (Blue Circle), T vs NBI (Red Circle), WL vs NBI (Green Circle). For each group, upregulated miRNAs (red) and downregulated miRNAs (green) are tabulated. (B) Boxplots showing the expression profiles across the tumour margins of the 3 most upregulated and downregulated miRNA derived from the T vs NBI comparison. (C) Principal Component Analysis (PCA) plot of miRNA differential expression data showing spatial segregation according to biopsy location: T- tumour; WL – white light; NBI – narrow band imaging.

