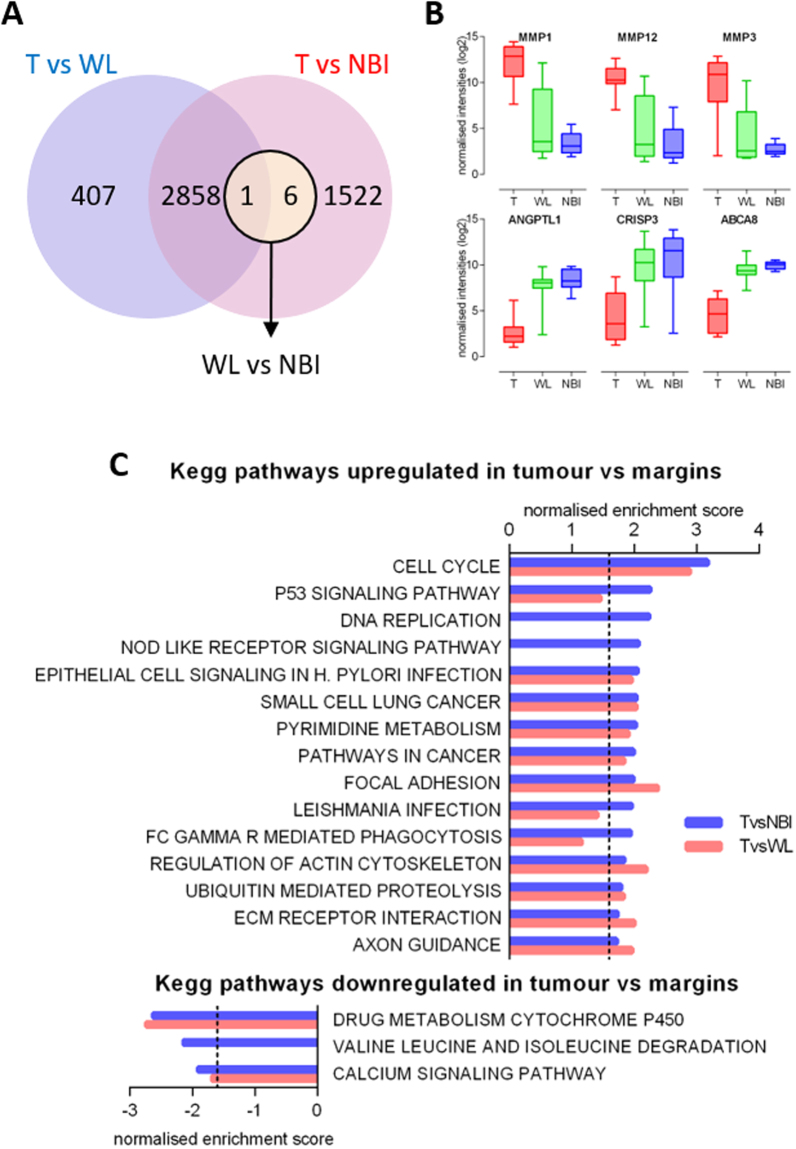
Figure 4.
Differential mRNA expression in OSCC margins (A) Venn diagram illustrating the relationship between differentially expressed mRNAs in the three discrete comparisons: T vs WL (Blue Circle), T vs NBI (Red Circle), WL vs NBI (Green Circle). (B) Boxplots showing the expression profiles across the tumour margins of the 3 most upregulated and downregulated mRNA derived from the T vs NBI comparison. (C) Pathway analysis of dysregulated genes (mRNA) between the OSCC margins. Up and down regulated pathways were determined using GSEA and the MsigDb curated KEGG database genesets. Pathways are ranked according to normalised enrichment score generated by GSEA. Threshold of significance is shown by the dashed line.

