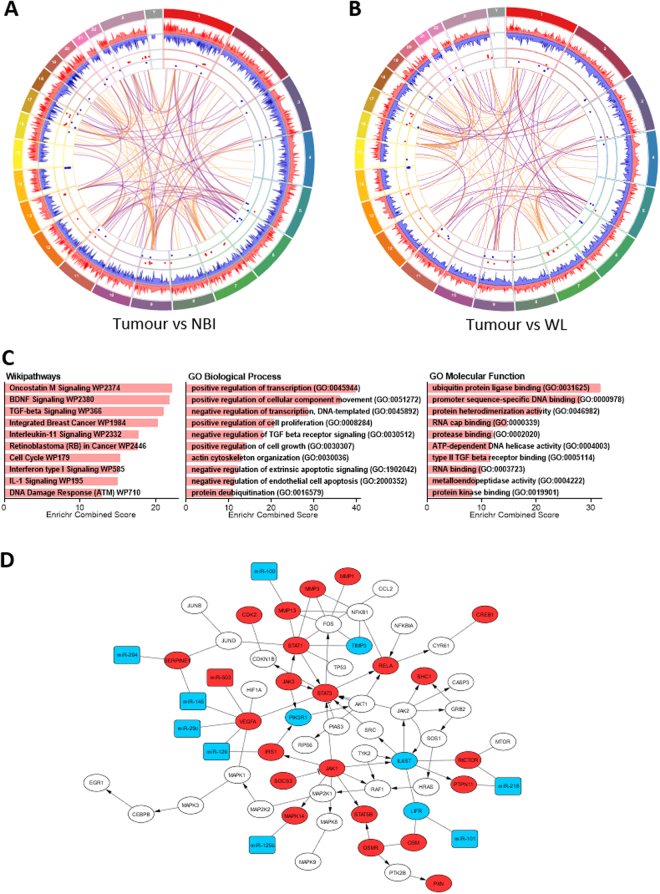
Figure 5.
Circos plots of gene and miRNA differential expression and potential regulatory linkages for (A) tumour vs NBI and (B) tumour vs WL. Outermost track is chromosome mapping. Histogram plot tracks show differential gene (mRNA) expression as up (red) and down (blue) regulated (−Log(10) P-value). Dot plot tracks show differential microRNA (miRNA) expression as up (red) and down (blue) regulated (−Log(10) P-value). Innermost track (centre) shows correlated miRNA-mRNA linkages as reciprocal (purple) and non-reciprocal (orange). (C) Functional enrichment of the correlated miRNA-mRNA dataset by overrepresentation analysis of pathways and gene ontology. The target correlated mRNA were used with the EnrichR analysis tool to derive significantly perturbed pathways and gene ontology associations. The top 10 pathways/ontology terms for each analysis are shown ranked by the EnrichR combined score parameter. (D) Functional relationships of candidate miRNA-mRNA interactions mapped onto the Oncostatin M signalling network using Cytoscape. mRNA nodes are oval and miRNA nodes are rectangular. For both mRNA and miRNA upregulated nodes are red and downregulated are blue.

