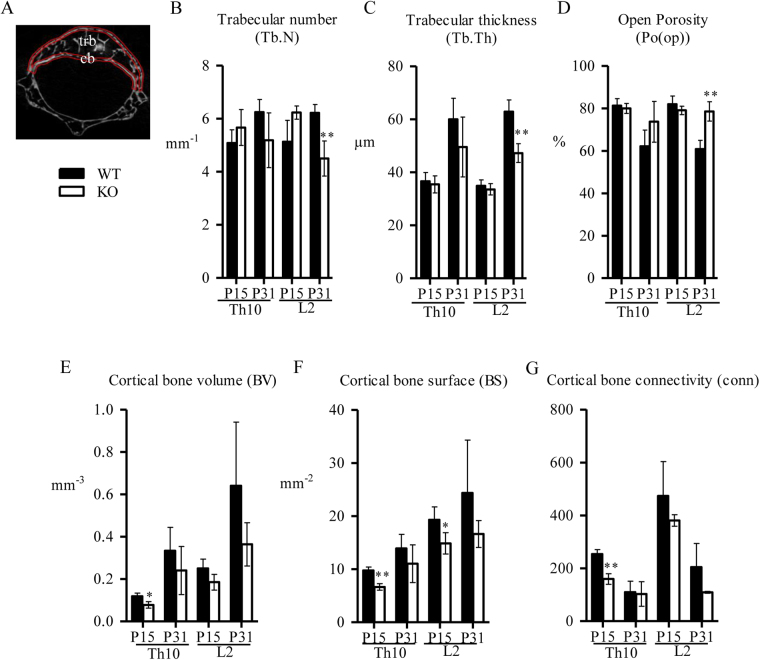
Figure 3.
µCT analysis of the trabecular and cortical bone in Th10 and L2 vertebrae. (A) Regions of Interest (ROIs) of the trabecular (tbr) and cortical (cb) vertebrae are marked. (B–D). Trabecular number (Tb.N) (B), thickness (Tb.Th) (C) and open porosity (Po(op)) (D) indicate that depletion of Spef2 affects the trabecular bone content and structure. (E–G) Cortical bone volume (BV) (E), surface (BS) (F) and connectivity (conn) (G) suggests decreased bone volume and structure in the Spef2 KO vertebra. Error bars ± SD; * = p < 0,05; ** = p < 0,01; *** = p < 0,001.

