Figure 4.
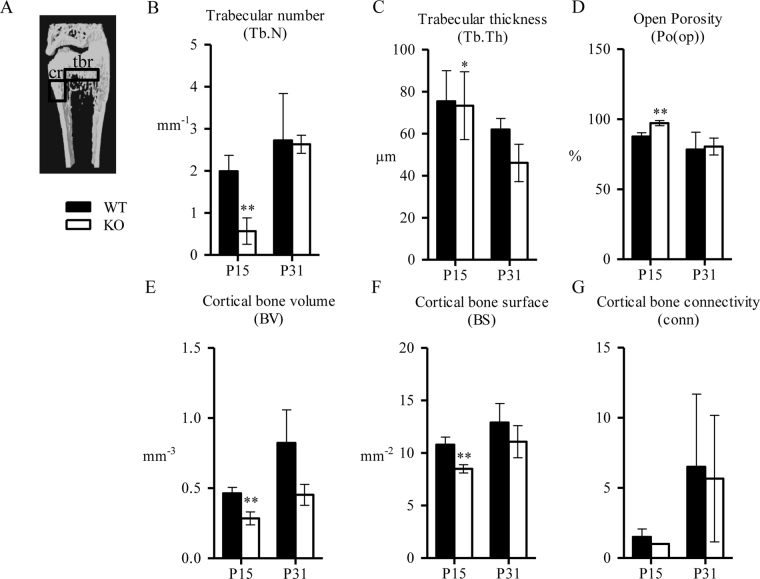
µCT analysis of the distal femur trabecular and cortical bone. (A) ROI for the trabecular bone (tbr) was drawn starting from the distal growth plate of the femur, extending for 1 mm towards diaphysis, excluding the cortical bone material. ROI for the cortical bone (cr) was drawn starting from 1 mm from the distal growth plate to the diaphysis, extending a longitudinal distance of 1 mm. (B–D) Trabecular number (Tb.N) (B), thickness (Tb.Th) (C) and open porosity (Po(op)) (D) indicated reduced trabecular bone content and impaired structure. (E–G). Cortical bone volume (BV) (E), surface (BS) (F) and connectivity (conn) (G) showed decreased cortical bone volume and structure in Spef2 KO femurs. Error bars ± SD; * = p < 0,05; ** = p < 0,01; *** = p < 0,001.

