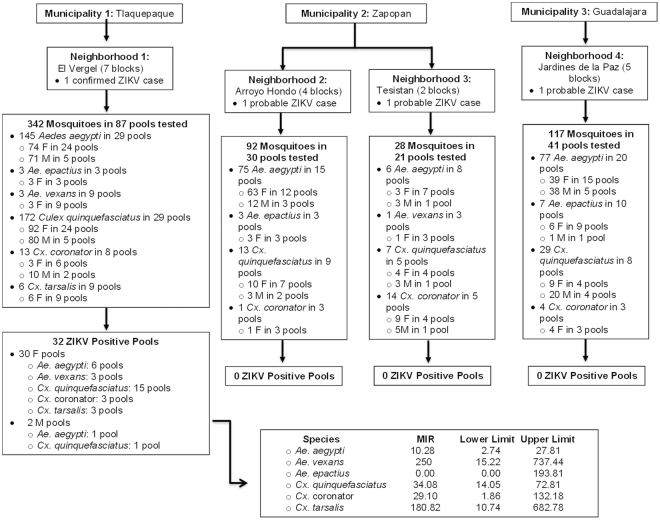
Figure 2.
Flow chart of mosquito collection in the metropolitan area of Guadalajara, Jalisco, Mexico. The figure outlines the collection municipalities and their neighborhoods, as well as the mosquitoes collected and the pools assembled for each area. The neighborhood El Vergel was the only area with mosquitoes positive for ZIKV. Also presented is the minimum infection rate (MIR) per species and the confidence intervals. F = Female; M = Male; ZIKV = Zika Virus.

