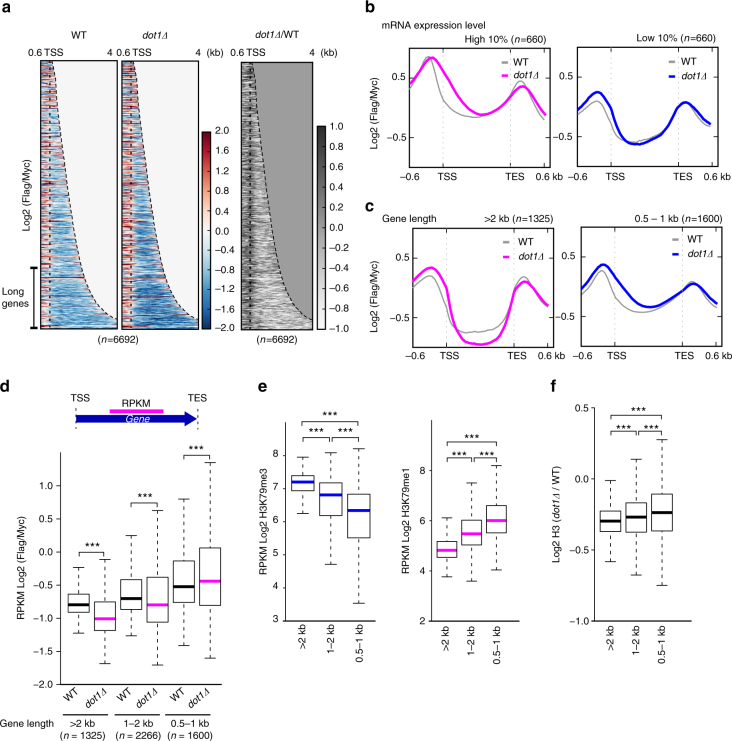
Fig. 5.
Dot1p preferentially affects histone exchange in long genes. a Heatmap of histone exchange (log2 Flag ChIP/Myc ChIP) at all genes of yeast (n = 6692). The read counts were obtained from biological duplicates. Profiles are shown in ascending order of the length of the transcribed region. Dotted lines indicate the TSS. Genes >2 kb in length are indicated as ‘Long Genes’. The value of the region exceeding the TES is treated as 0. Left, wild-type; center, dot1Δ; right, dot1Δ relative to wild type. The color bar represents value of log2 Flag/Myc (color red: >0, color blue: <0, for left and center panel; color black: >0, color white: <0, for right panel). b, c Total genes were clustered based on their b mRNA expression levels and c gene lengths. The gray line indicates the histone exchange rate in wild-type cells. Magenta lines indicate clusters of genes having high mRNA expression levels (b, n = 660) and those longer than 2 kb in length (c, n = 1325) in dot1∆ cells. Blue lines indicate clusters of genes having moderate mRNA expression levels (b, n = 660) and those of 0.5–1 kb in length (c, n = 1600). The values of the y-axis indicate histone exchange, and the x-axis indicate distance from TSS and TES. d, e ***P-value <0.001. The upper panel of (d) shows a schematic diagram of our analysis. Magenta colored line, the center of transcribed regions, represents the region where taken to be values in the boxplots in (d, e). d A boxplot of histone turnover RPKM values obtained at the centers of the transcribed regions in wild-type and dot1Δ cells for each gene length cluster (i.e., >2 kb, 1–2 kb, and 0.5–1 kb). e A boxplot of the RPKM values for H3K79me3 and H3K79me1 at the centers of transcribed regions. Genes are clustered based on gene length as described for (d), and the boxplots present H3K79me3 (left) and H3K79me1 (right). f The level of histone H3 is clearly related to gene length. A boxplot presents the log2 fold change of H3 in dot1Δ versus wild-type cells at the centers of transcribed regions, as normalized by gene length (RPKM)

