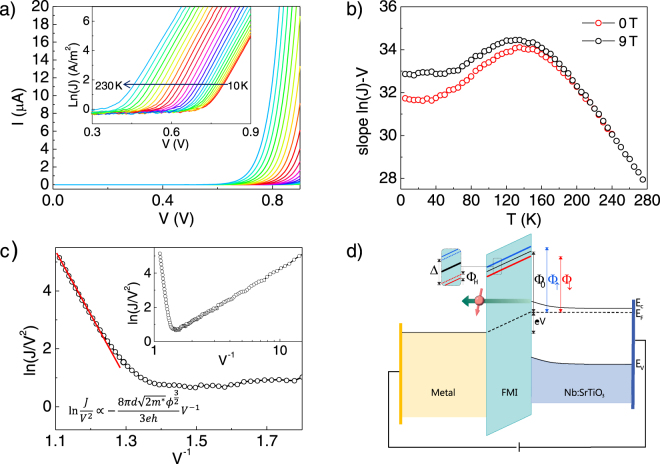
Figure 2.
(a) I-V and corresponding ln(J)-V (inset) curves of the 2 nm-thick junction at different temperatures at zero magnetic field (temperatures from 10 K to 230 K every 10 K are represented). (b) ln(J)-V slope of the 2 nm-thick junction I-V curves as a function of temperature at zero field (red) and under 9 T OOP (black). (c) ln(J/V2)-V−1 plot from the curve at 10 K (from panel (a)) to determine the tunneling transport mechanism. The straight slope in the high voltage region indicates Fowler-Nordheim tunneling. (d) Schematics of the band diagram of our experimental configuration with forward applied bias. Φ0 is the tunneling barrier and splits into Φ↑ and Φ↓. In the zoom Δ is the exchange splitting and ΦH is the additional splitting under an applied magnetic field.

