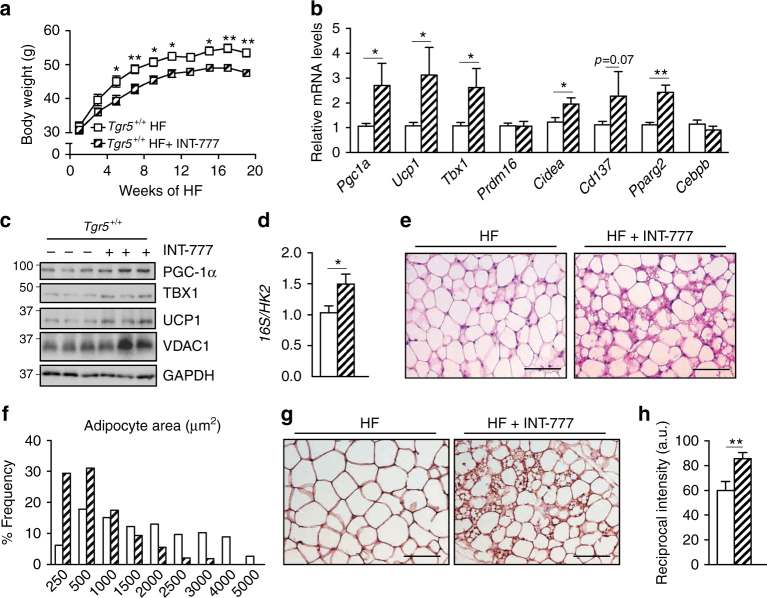
Fig. 4.
TGR5 activation induces scWAT beiging in mice fed a high-fat diet. a Body weight curves of TGR5 wild-type (Tgr5+/+) fed a high-fat (HF) diet for 20 weeks in the presence or absence of the selective TGR5 agonist INT-777. n = 10 per group. b mRNA levels of beige remodelling markers Pgc1a, Ucp1, Tbx1, Prdm16, Cidea, Cd137, Pparg2 and Cebpb in the scWAT of mice described in a. c Representative (n = 10 per group) western blot of PGC-1α, the mitochondrial marker VDAC1, and beiging markers TBX1 and UCP1 from the scWAT of mice described in a. GAPDH was used as loading control. d Quantification of mitochondrial (16S) vs. nuclear (HK2) DNA ratio from the scWAT of mice described in a. e Representative haematoxylin and eosin staining from the scWAT of mice described in a. f Adipocyte area quantification from images shown in e. g Representative (n = 5 per group) UCP1 immunostaining of scWAT sections from mice described in a. h Quantification of UCP1 immunostaining intensity depicted in g. Scale bars = 50 μm. Results represent mean ± SEM. *P ≤ 0.05 and **P ≤ 0.01 vs. Tgr5+/+ HF group by two-way ANOVA followed by Bonferroni post hoc test (a) or Student’s t test (b, d, h). Uncropped western blots are provided in Supplementary Fig. 12A and B

