Figure 2.
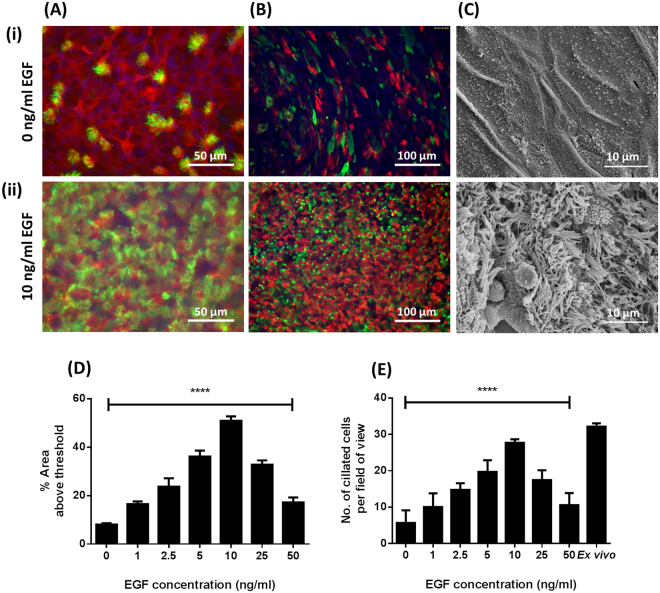
Effect of EGF on cell differentiation of BBEC cultures. BBEC cultures were grown for 21 days at an ALI with varying concentrations of EGF before fixation. The BBEC cultures were subsequently immunostained to assess (A) ciliation (cilia - green; F-actin - red; nuclei - blue) and (B) mucus production (mucus - green; cilia - red; nuclei - blue) or (C) examined by SEM. Representative images are shown of BBECs grown in the presence of (i) 0 and (ii) 10 ng/ml EGF (see Figs. S3A, B and D). Quantitative analysis of ciliation of the apical surface of BBEC cultures grown in the presence of 0, 1.0, 2.5, 5.0, 10.0, 25.0 and 50.0 ng/ml EGF was performed using (D) fluorescence intensity thresholding of immunostained cultures (see Fig. S3A) and (E) by counting the number of ciliated cells per field of view in H&E-stained sections (see Fig. S1A). In (D), ciliation was quantified by measuring the area above a fluorescence intensity threshold in ImageJ; for each insert, five regions evenly distributed across the sample were measured. In (E), for each insert, ciliated cells were counted in each of five 400x fields of view evenly distributed across the sample. For all of the above quantifications, three inserts were analysed per growth condition and the data represents the mean +/− standard deviation from tissue derived from three different animals. Statistical significance was tested using an Ordinary one-way ANOVA: **** = P < 0.0001.

