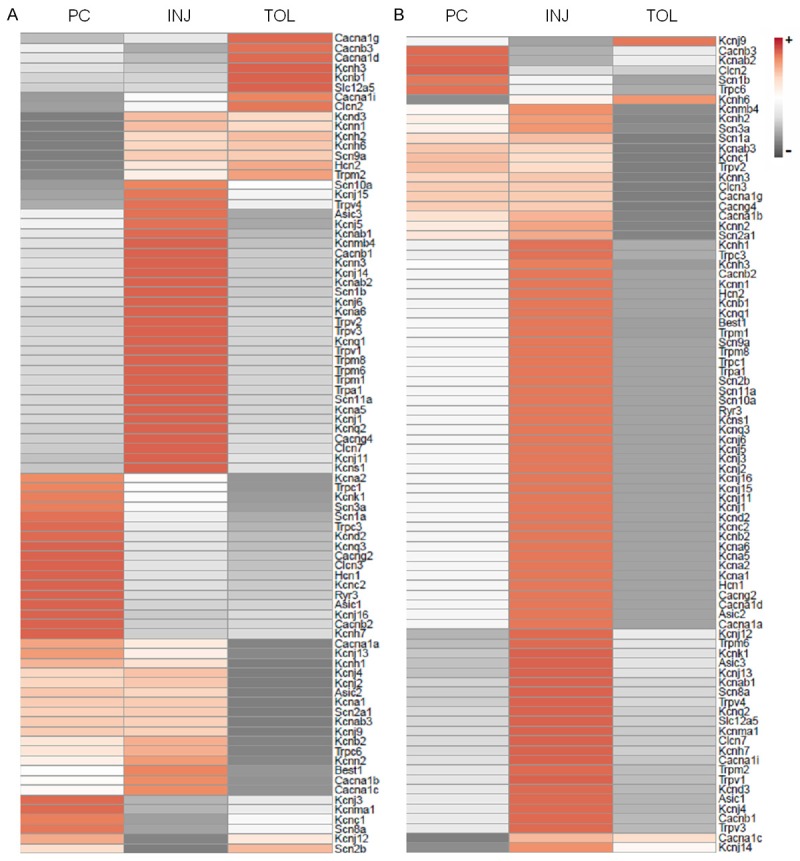
Figure 2.

Heatmaps of expressional changes in neuronal ion channel genes under the three principal ischemic conditions. The heatmaps were generated using the fold regulations listed in Table 1 and arranged according to the tightest clustering. The scale bar indicates the direction of changes (+ and -, an increase or decrease, respectively, when ischemic groups were compared with the appropriate controls). A. Mouse brains; B. Cultured neuronal NS20Y cells. PC, INJ, and TOL: Same as in Figure 1.
