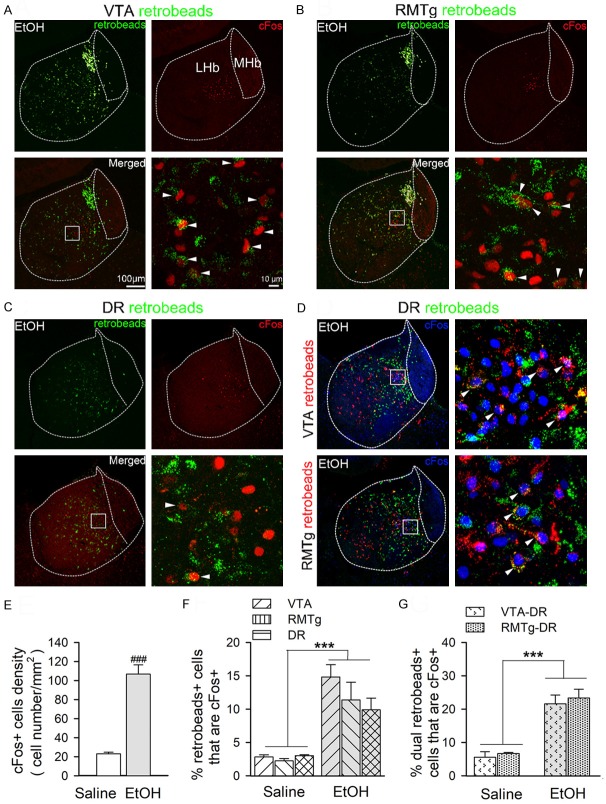
Figure 3.
Ethanol-activated LHb neurons project to VTA, RMTg, and DR. Compared to saline, ethanol (0.25 g/kg, i.p.) significantly elevated the number of double-labeled (retrobeads- and cFos-positive) LHb cells that project to VTA (A), RMTg (B), and DR (C). However, there was no significant difference in the percentage of double-labeled cells in retrobeads+ LHb cells among these three projection sites. Moreover, few LHb neurons activated by ethanol simultaneously project to both the VTA and DR or both the RMTg and DR (D). Right panels show an enlarged view of the boxed areas. Arrowheads indicate the cells with cFos and retrobead co-labeling. (E) Summary graph of cFos+ cells density in ethanol and saline treatment groups. Since no significant differences were found in total number of cFos+ neurons within saline or ethanol treatment group, the within-group data were collapsed for analysis. ###p < 0.001, vs. saline, by t-test. (F and G) Summary graphs of percentage of cFos+ and retrobeads colabeled cells in total retrobeads retrogradely labeled LHb neurons. ***p < 0.001, vs. saline group. Two-way ANOVA followed by Tukey’s post hoc analysis, n=6 rats/group, 8-9 sections/rat. Scale bars =100 μm or 10 μm.

