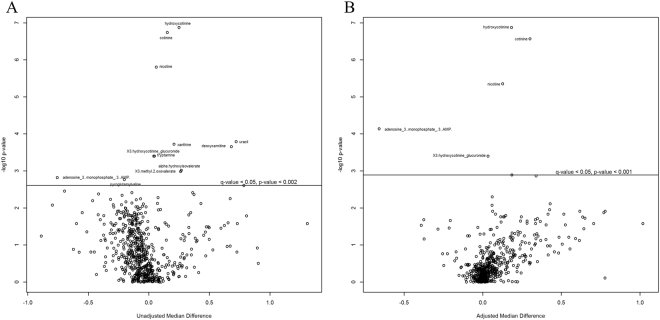
Figure 1.
Compounds differing between smokers and non-smokers with and without adjustment for CST. Volcano plots display –log10 (p-value) and the median difference in concentration between smokers and non-smokers when unadjusted (A) and adjusted for community state type (B). Quantile regression was conducted on centered and scaled metabolite concentrations. Significance testing was conducted with Wilcoxon rank sum test and corrected for multiple comparisons. Metabolites that differed significantly where q-value < = 0.05 between smokers and non-smokers are shown above the line in each plot.

