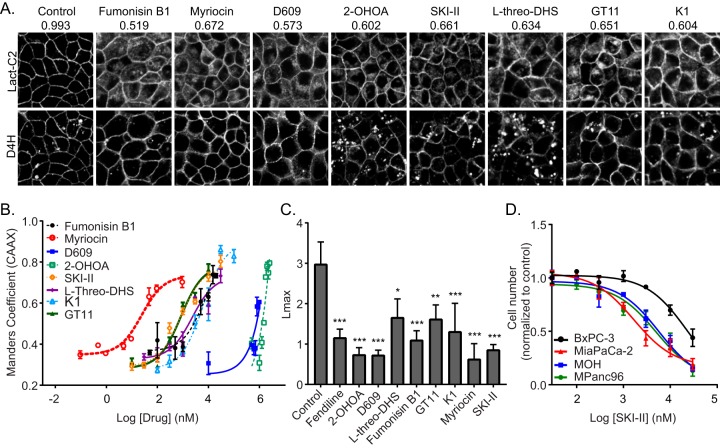
FIG 7.
Perturbation of Cer-SM biosynthetic pathway in mammalian cells alters PtdSer and K-Ras localization and impairs K-Ras function. (A) Representative confocal images of MDCK cells stably coexpressing mGFP-LactC2 and the cholesterol probe mCherry-D4H treated with vehicle (DMSO), 20 μM fumonisin B1, 50 nM myriocin, 100 μM D609, 175 μM 2-OHOA, 10 μM SKI-II, 30 μM l-threo-DHS, 30 μM K1, or 10 μM GT11 for 48 h. mGFP-LactC2 mislocalization was quantified using ImageJ. Mean Manders coefficients for each treatment are shown above the respective images. (B) MDCK cells stably coexpressing mCherry-CAAX and mGFP–K-RasG12V were treated with vehicle (DMSO) or various concentrations of pharmacological modulators of the Cer-SM biosynthetic pathway for 48 h and imaged by confocal microscopy. K-RasG12V mislocalization was quantified using Manders coefficients as the fraction of mCherry-CAAX colocalizing with mGFP–K-RasG12V. The Manders coefficient for DMSO-treated control was 0.292 ± 0.02. (C) Basal PM sheets prepared from MDCK cells expressing mGFP–K-RasG12V after treatment with vehicle (DMSO), 20 μM fumonisin B1, 50 nM myriocin, 100 μM D609, 175 μM 2-OHOA, 10 μM SKI-II, 30 μM l-threo-DHS, 30 μM K1, or 10 μM GT11 for 24 h were labeled with anti-GFP-conjugated gold particles and visualized by EM. The peak values, Lmax, of the weighted mean K function L(r) − r curves are shown as bar graphs (n = 20). Significant differences were evaluated in bootstrap tests (*, P < 0.05; **, P < 0.01; ***, P < 0.001). (D) A panel of wild-type (BxPC-3) or oncogenic mutant K-Ras-expressing (MiaPaCa-2, MOH, MPanc96) pancreatic tumor cells were seeded in 96-well plates and treated for 72 h with vehicle (DMSO) or various concentrations of SKI-II. The number of viable cells was quantified using the CyQuant cell proliferation assay kit (Molecular Probes).

