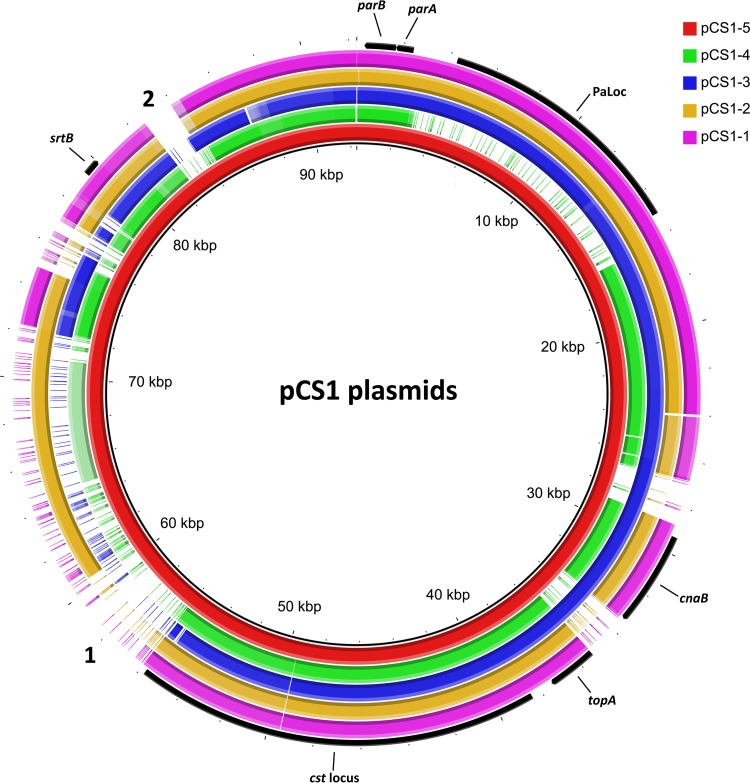
FIG 1 .
Comparison of pCS1-5 to other members of the pCS1 family. Shown is a visual representation of results of a blastn analysis comparing the pCS1-5 sequence and the other four unique pCS1 plasmid sequences. Each colored ring represents an individual pCS1 member. The innermost ring (colored red) and the coordinates (indicated in kilobases) represent pCS1-5. Plasmids displaying 70% to 100% identity to pCS1-5 at a particular location are represented with a solid block of color on the corresponding ring. Where the level of homology to a particular region is between 50% and 70%, it is represented as a pale block of color. Where identity to a particular region from pCS1-5 is less than 50%, it is represented by a gap on the corresponding ring. Regions present only on pCS1-5 are annotated with a number on the edge of the alignment. Genes and regions of interest from pCS1-1 are annotated on the outermost ring. The figure was produced using BRIG.

