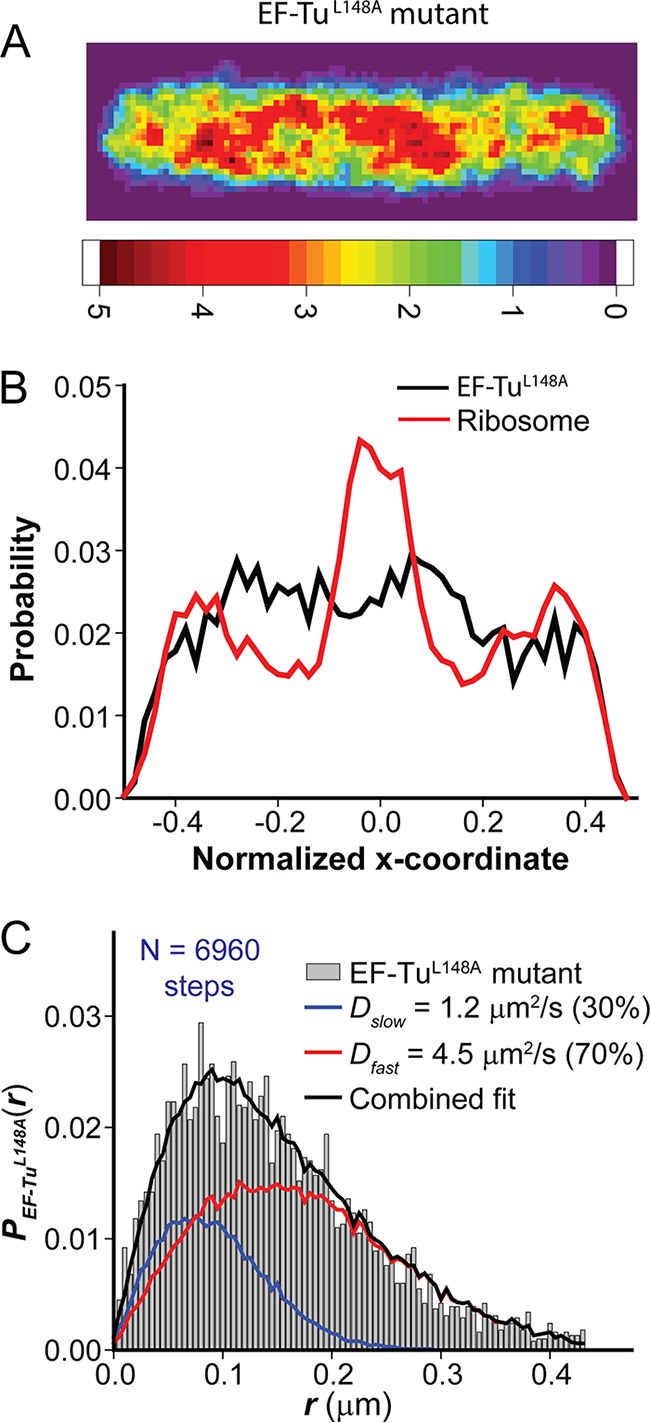
FIG 4 .

(A) Composite spatial distribution heat map of the mutant form EF-TuL148A–mEos2 for 792 localizations from 123 E. coli cells of length 4 to 5.5 µm. Pixels are ~45 by 45 nm. The intensity scale shows relative counts per pixel. (B) Axial distributions of EF-TuL148A mutant (black) in comparison with ribosomes (30S-mEos2 labeling [red]). The distributions are normalized to the same area and plotted on a relative scale of −0.5 to +0.5 for the long axis. (C) Distribution of single-step displacements P(r) (gray histogram) for 6,960 steps of the EF-TuL148A mutant. The solid black line shows the best-fit model using two static states: “slow” (blue) and “fast” (red). Model parameters: fslow = 0.3, Dslow = 1.2 µm2/s, ffast = 0.7, and Dfast = 4.5 µm2/s.
