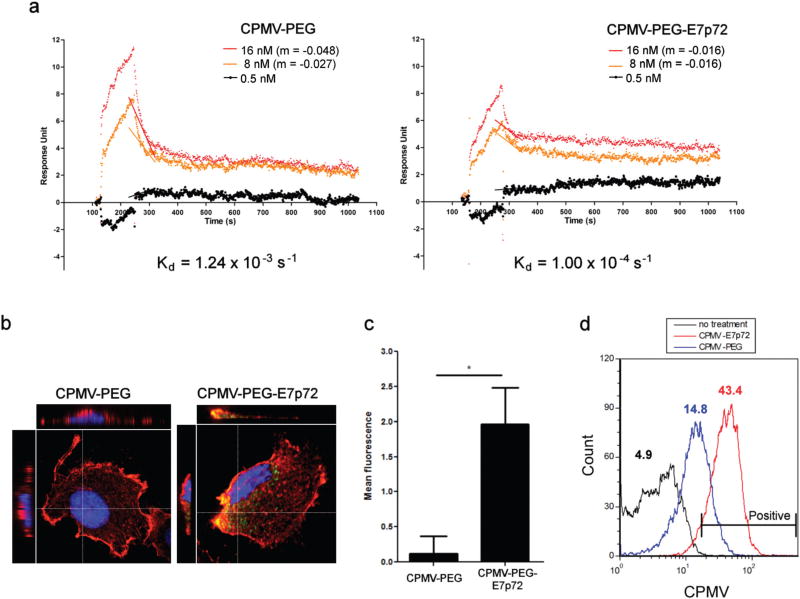
Fig. 5.
CPMV-PEG-E7p72 nanoparticles target human endothelial cells. (a) SPR curves generated from the interaction and dissociation of CPMV-PEG-E7p72 or CPMV-PEG nanoparticle (at concentrations 16 nM, 8 nM and 0.5 nM) with immobilized EGFL7 using the Biacore 3000. Association curves were obtained by exposing EGFL7 immobilized on the SPR chip with CPMV-PEG-E7p72 or CPMV-PEG (control) nanoparticle. At t = 280 s, the dissociation curves were generated when the injection of nanoparticles was substituted with binding buffer. CPMV-PEG-E7p72 nanoparticle displayed a much lower dissociation rate compared to CPMV-PEG. The slopes (m) depicting the dissociation rates of the two highest concentrations are indicated in this plot. (b) (Left) Confocal images (using the 20× objective) showing the uptake of CPMV-PEG-E7p72 nanoparticle (white arrow), but not control CPMV-PEG nanoparticle by human endothelial cells. AF 647 signal from CPMV (green), plasma membrane labeled with wheat germ agglutinin (WGA) (red), and nuclei staining (blue). Scale bar, 10 microns. (Right) Bar graph showing the mean fluorescence intensity of cells from each group. Quantification of peptide uptake was performed by obtaining the mean AF 647 signal intensity within each cell using Volocity software, v 6.1. The uptake of CPMV-PEG-E7p72, was significantly higher than that of control CPMV-PEG (n = 20, p < 0.05). All statistics were performed using a one-way ANOVA and Tukey post hoc test. (c) Z-Stack confocal microscopy images (using the 60× objective) of cells from (b) showing the internalization of CPMV-PEG-E7p72 nanoparticles. (d) Histogram indicating the uptake of CPMV-PEG-E7p72 and CPMV-PEG (control) by EA.hy926 endothelial cells. Flow cytometry was conducted using the BD FACSCalibur flow cytometer and data was analyzed using the FCS Express software. The mean fluorescence intensity of each group is indicated in the plot (n = 10 000).

