Figure 1.
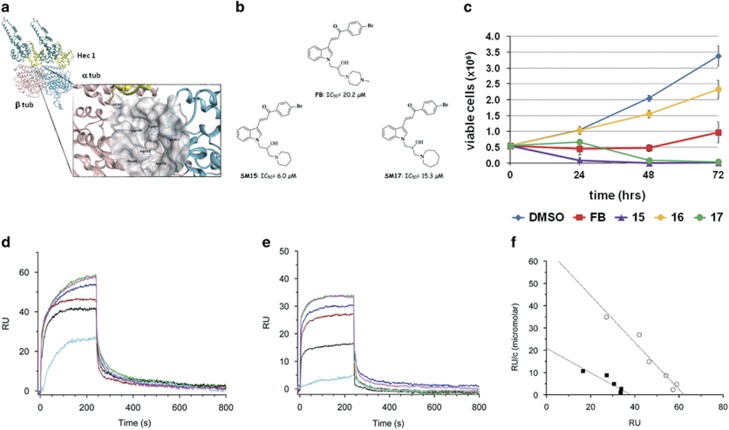
A virtual screening targeted to the MT–Hec1 interaction identifies highly cytotoxic compounds. (a) Crystal structure of the α (sky blue) and β (pink) tubulin dimer in association with the Ndc80-SPC25 chimera protein (teal). The ‘toe’ region of Hec1 is in yellow. The zoom highlights the pocket (represented as gray molecular surface) at the interface between the two tubulin monomers where the virtual screening study has been performed. Important amino acid residues from α-tubulin chain and β-tubulin chain are reported. Hec1 Lys166 is in proximity of the selected pocket. The protein backbone is shown as ribbon. (b) Chemical structure of FB and its derivatives SM15 and SM17. (c) Time course viability assay for selected compounds (FB, SM15, SM16, SM17). Data are means±s.e.m. of 2–4 independent experiments. (d) Sensorgrams showing the interaction between MTs, immobilized on a COOH5 chip, and SM15 at different concentrations. (e) Sensorgrams showing the interaction between tubulin, immobilized on a COOH5 chip, and SM15 at different concentrations. Concentrations of SM15 were: 0.78 μM: cyan; 1.56 μM: black; 3.12 μM: red; 6.25 μM: blue; 12.5 μM: green; 25 μM: magenta. The increase in RU relative to baseline indicates complex formation; the plateau region represents the steady-state phase of the interaction, whereas the decrease in RU represents dissociation of SM15 from immobilized ligands after injection of running buffer. (f) Scatchard plots of SPR experiments showing the interaction (that is, RU values at equilibrium) of SM15 at different concentrations with MTs (circles) and tubulin (squares). Upon linear fitting, KD values of 0.94±0.13 μM and 1.8±0.4 μM were calculated for the SM15 interaction with MTs and tubulin, respectively.

