Figure 2.
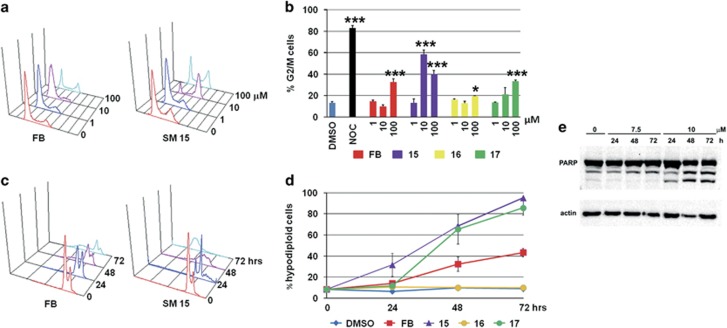
MT-Hec1-interacting SMs lead to a G2/M phase accumulation and induce apoptosis in HeLa cells. (a) Representative flow cytometric histograms of cell cycle distribution following 24 h exposure to different concentrations of FB and SM15. X axis=DNA content (linear scale), Y axis=number of events. (b) Quantitative analysis of the percentage of cells in G2/M phases of the cell cycle after 24 h exposure to FB, SM15, SM16 and SM17. Data are means±s.e.m. of 2–4 independent experiments. 1 μM nocodazole (NOC) was used as positive control. ***P < 0.001. (c) Representative flow cytometric histograms of the hypodiploid peak following different exposure times to 10 μM FB or SM15. X axis=DNA content (log scale), Y axis=number of events. (d) Quantitative analysis of the percentage of hypodiploid cells following different exposure times to 10 μM FB, SM15, SM16 and SM17. Data are means±s.e.m. of 2–4 independent experiments. (e) Western blotting analysis of PARP cleavage after different exposure times to 7.5 and 10 μM SM15. Actin is shown as loading control.

