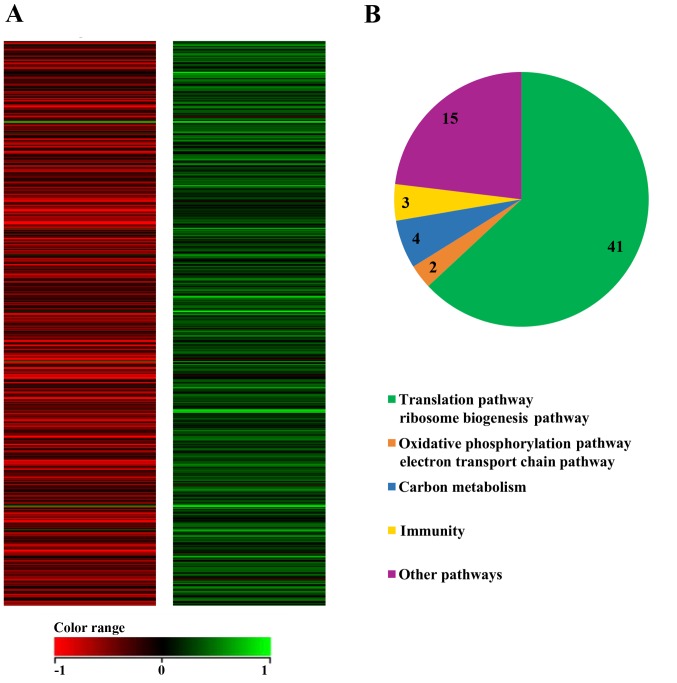
Figure 3.
(A) Heat map showing the normalized expression of differentially regulated genes, filtering criteria >2-fold change in flavopiridol-treated and untreated MCF7 CD44+/CD24− cancer stem cells. Red color indicates high expression, while green color indicates expression. (B) Pie chart representing the proportion of genes associated with various pathways. CD, cluster of differentiation.

