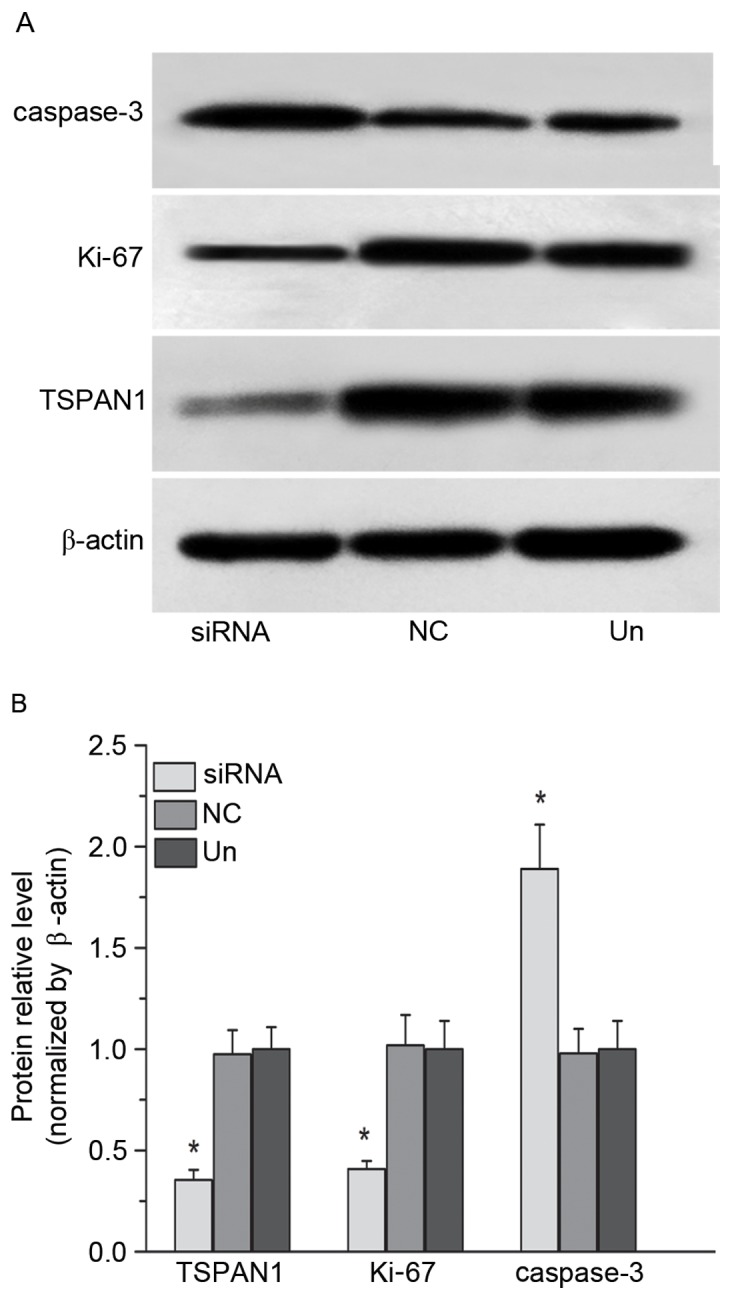
Figure 4.

Expression levels of TSPAN1, Ki-67 and caspase-3 protein in Eca-109 cells were measured by (A) western blot analysis and (B) densitometric analysis. Compared with the negative control group, the TSPAN1 protein level was significantly decreased in the TSPAN1 siRNA group (0.35±0.05 vs. 0.97±0.12), the Ki-67 protein level was highly reduced in the TSPAN1 siRNA group (0.41±0.04 vs. 1.02±0.15) and the caspase-3 protein level was increased in the TSPAN1 siRNA group (1.89±0.22 vs. 0.98±0.12). All data are expressed as a percentage of the negative control group volume density. *P<0.05. TSPAN1, tetraspanin 1; siRNA, small interfering RNA; NC, negative control; Un, untreated.
