Figure 5.

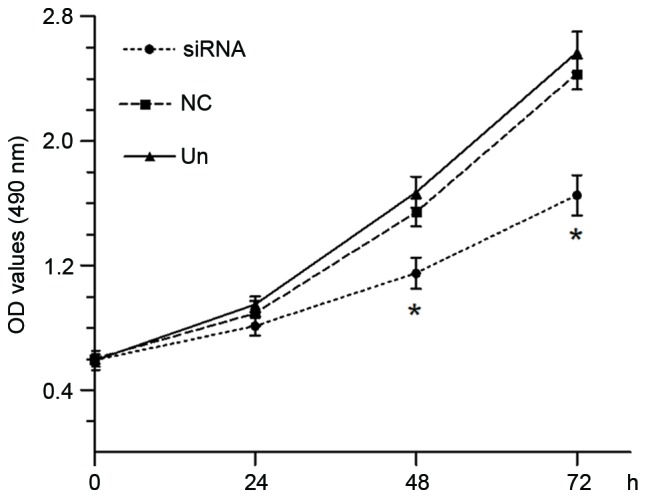
The proliferation of Eca-109 cells was assayed using MTT at 0, 24, 48 and 72 h post-transfection. Growth curve showed that the OD values (490 nm) obviously decreased in TSPAN1 siRNA group at 48 (1.15±0.10 vs. 1.54±0.09) and 72 h (1.65±0.13 vs. 2.43±0.11). *P<0.05 compared with the negative control group at the same time point. TSPAN1, tetraspanin 1; siRNA, small interfering RNA; OD, optical density; NC, negative control; Un, untreated.
