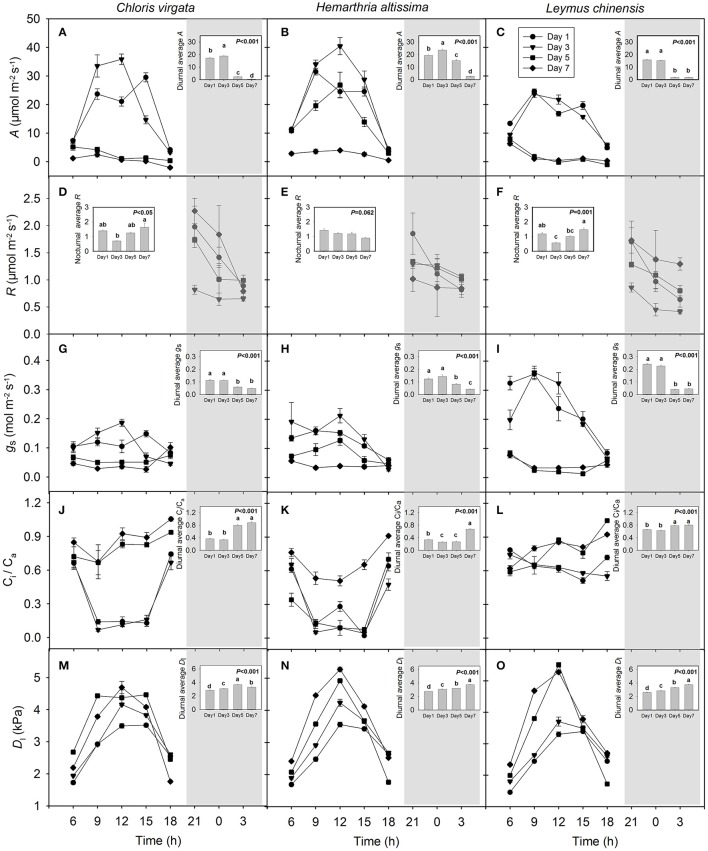
Figure 1.
Variations of (A–C) leaf net CO2 assimilation rate (A; μmol m−2 s−1), (D–F) respiration rate (R; μmol m−2 s−1), (G–I) stomatal conductance (gs; mol m−2 s−1), (J–L) Ci/Ca ratio (unitless) and (M–O) leaf-to-air vapor pressure deficit (Dl; kPa) on the day 1 (circle), day 3 (triangle), day 5 (square) and day 7 (diamond) of the drought treatment in Chloris virgata (annual C4), Hemarthria altissima (perennial C4) and Leymus chinensis (perennial C3). Diurnal average values are presented as an inset figure. Different lowercase letters in the inset figures indicate significant differences (P < 0.05) between the sampling dates (Tukey's test). Data are reported as the arithmetic mean ± 1 standard error (n = 5). The shaded area denotes the dark period.

