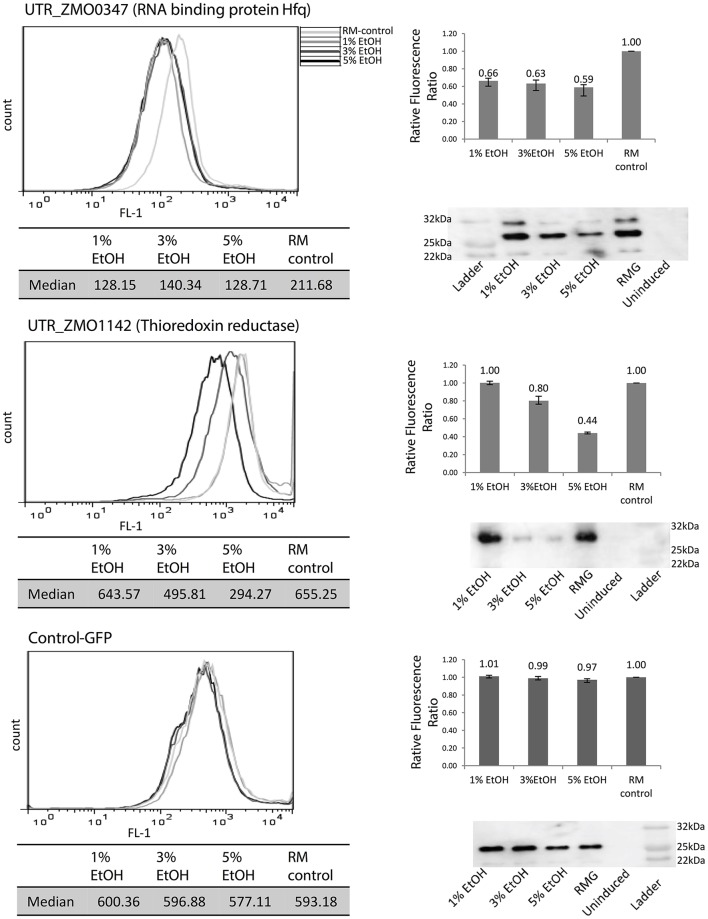
Figure 4.
Identification of 5′UTRs that regulate GFP expression under ethanol stress. UTR_ZMO0347 and UTR_ZMO1142 showed fluorescence shifts under different levels of ethanol compared to control-GFP. White gray line: RMG (normal media). Light gray line: 1% ethanol supplemented media. Dark gray line: 3% ethanol supplemented media. Black line: 5% ethanol supplemented media. Median fluorescence level of each condition is shown in a table and the fluorescence ratios relative to the RMG control are shown in the bar graphs. GFP protein levels were detected by western blotting using anti-GFP antibody. These experiments were done in triplicate and the fluorescence ratio bar graph error bars represent standard deviation from the mean.

