Figure 5.
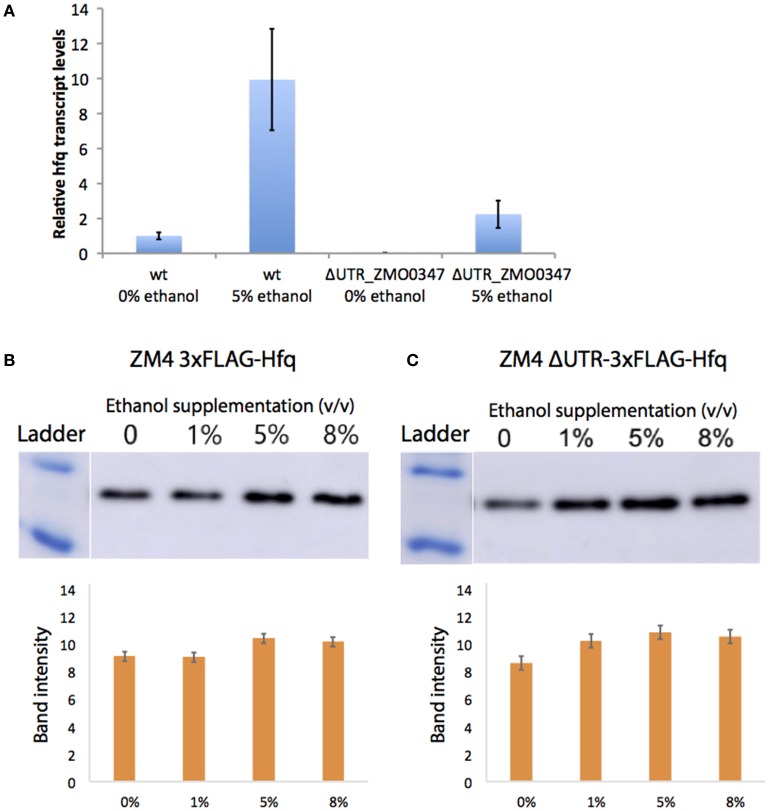
Native regulation of Hfq in ethanol stress. Transcript levels of hfq were quantified by qPCR with (5%) and without (0%) ethanol supplemented to the media (A). Bars represent averages of biological triplicates calculated by the comparative delta-delta threshold cycle (ΔΔCT) method and error is standard deviation. The Hfq protein levels were quantified by western blots of chromosomally FLAG-tagged Hfq strains with the UTR (B) and without (C). After growth in a range of ethanol concentrations, 20 ng of total protein were loaded into an SDS-PAGE gel, then transferred to a membrane, and blotted with the anti-FLAG antibody. Band intensity was quantified and is shown as averages of biological triplicates with error as standard deviation.

