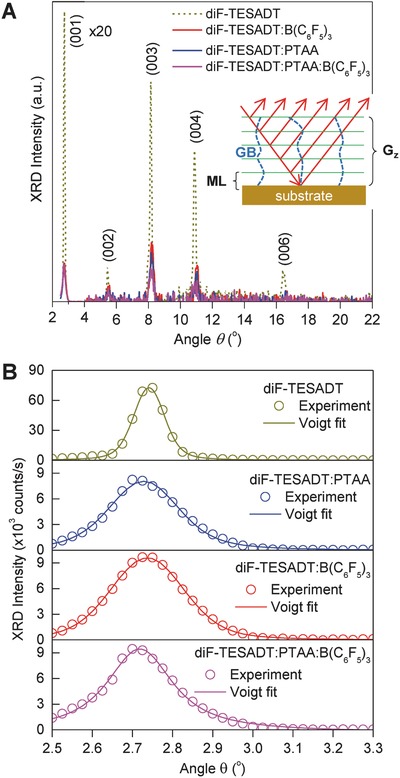
Figure 4.

a) X‐ray diffractograms for the four samples studied namely, diF‐TESADT, diF‐TESADT:B(C6F5)3, diF‐TESADT:PTAA, and diF‐TESADT:PTAA:B(C6F5)3(2.4 mol%). b) X‐ray diffractograms around the (001) peak (symbols) and the corresponding Voigt fits.
