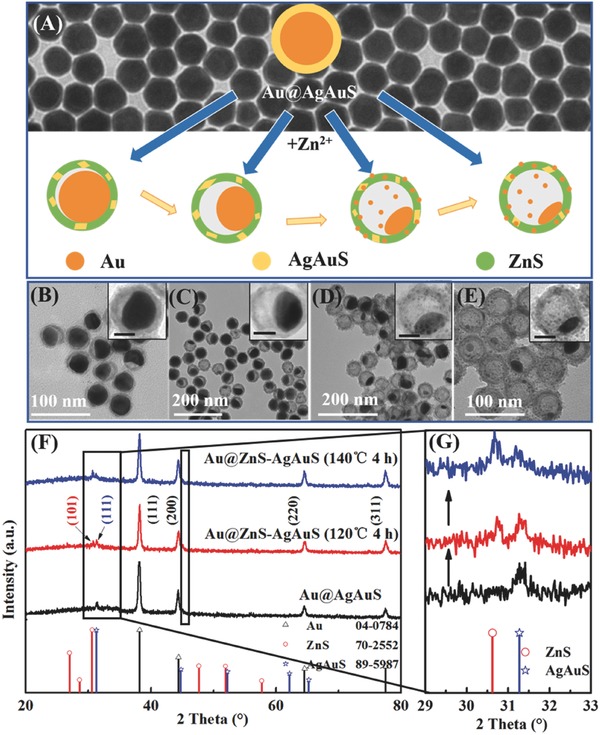
Figure 1.

A) Schematic process for the preparation of Au@ZnS–AgAuS Y–S NCs. Background shows the TEM image of Au@AgAuS core‐shell NCs. B–E) TEM images showing in situ chemical conversion reaction kinetics dependent evolution of Au@ZnS–AgAuS Y–S NCs, which were obtained at (B) 120 °C for 2 h and denoted as Au@ZnS–AgAuS (120 °C 2 h), (C) 120 °C for 4 h, denoted as Au@ZnS–AgAuS (120 °C 4 h), (D) 140 °C for 4 h, denoted as Au@ZnS–AgAuS (140 °C 4 h), and (E) 160 °C for 4 h, denoted as Au@ZnS–AgAuS (160 °C 4 h), respectively. Insets show the corresponding TEM images of the individual Y–S NCs (scale‐bar 20 nm) with enlarging of interior voids. F) XRD patterns of Au@AgAuS core‐shell NCs, Au@ZnS–AgAuS (120 °C 4 h) and Au@ZnS–AgAuS (140 °C 4 h) Y–S NCs. G) Enlarged XRD patterns.
