Figure 2.
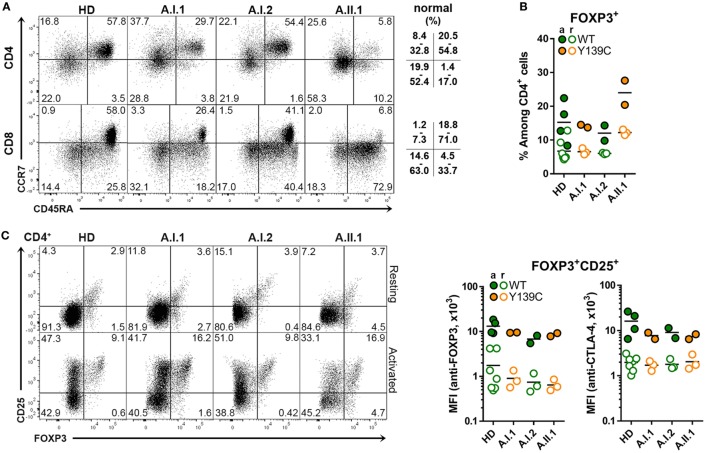
Cytotoxic T lymphocyte antigen-4 (CTLA-4) expression in TREG cells. (A) Representative flow cytometry plots of PBMCs stained with anti-CD3, CD4, CD8 CD45RA, and CCR7 antibodies. The plots show the population frequencies of naïve T cells (upper right), central memory T cells (upper left), effector memory T cells (bottom left) and CD45RA+ effector memory T cells (bottom right) cells in the CD3+CD4+ or CD3+CD8+ T cell subsets isolated from a healthy donors (HD), family members A.I1.1, A.I.2, and patient A.II.1. The normal range of each subset is indicated. (B) Percentage of FOXP3+ CD4+ TREG cells from HD and from family A members A.I.1, A.I.2, A.II.1 (patient). (C) Representative flow cytometry plots showing TREG cells of resting and anti-CD3 + anti-CD28-activated CD4+ T cells stained with anti-CD25 and anti-FOXP3 antibodies. The bar graph displays the mean fluorescence intensity of FOXP3 and of CD25 signals of resting (open circles) and activated (filled circles) CD4+ T cells isolated from HD and family A members A.I.1, A.I.2, and A.II.1 (patient). Horizontal lines represent mean values. The dots in (B,C) represent the samples of individual HD or family member analyzed in replicates in repeated experiments carried out after different visits.

