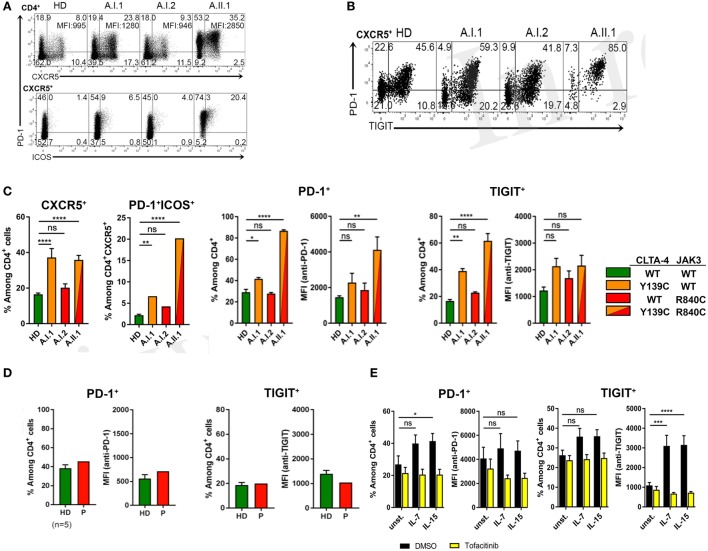
Figure 5.
PD-1 and TIGIT expression by TFH cells. (A) PD-1, CXCR5, and ICOS expression shown by representative flow cytometry plots of PBMCs gated on CD3+CD4+ from a healthy donor (HD) and members A.I.1, A.I.2, and A.II.1 (patient) of family A. Numbers in quadrant corners show population frequencies, additional numbers in upper right corner (top) represent mean fluorescence intensity (MFI) of PD-1 expressed by CXCR5+PD-1+ cells. (B) Flow cytometry plots of PBMCs showing PD-1 and TIGIT expression by CXCR5+CD4+ T cells. (C) Left panels: frequency of PD-1 and TIGIT expressing CXCR5+ and ICOS+ CD4+ T cells of HD (green), A.I.1 (orange), A.I.2 (red), and A.II.1 (red/orange). Middle panels: frequency of PD-1+ and of TIGIT+ CD4+ T cells and mean fluorescence intensity (MFI) of PD-1 and TIGIT expressed by CD4+ T cells of HD, A.I.1, A.I.2, and A.II.1 (D) PD-1 and TIGIT expression by an unrelated cytotoxic T lymphocyte antigen-4 (CTLA-4) haploinsufficiency patient with a heterozygous p.Y89X CTLA-4 mutation. (E) Frequency of PD-1 and TIGIT expressing CD4+ cells and expression levels of PD-1 and TIGIT determined by the MFI of PD-1 and TIGT expressed by CD4+ T cells treated for 5 days with or without (unst.) IL-7 and IL-15 in the presence or absence of the JAK inhibitor tofacitinib. Data in (C) represent mean ± SEM of 26 different donors (HD, CXCR5+, and PD-1+ICOS+) and two family visits, or mean ± SEM of 4 (TIGIT) and 7 (PD-1) different HDs and 2 (TIGIT) and 3 (PD-1) family visits, in (D) the mean ± SEM of five different HDs and the CTLA-4 p.Y89X patient, and in (E) show the mean ± SEM of three experiments with six different HDs. ****P ≤ 0.0001; ***P < 0.001; **P < 0.01; *P ≤ 0.05. One-way (A,C) or two-way (D) ANOVA, Dunnett’s multiple comparisons test.

