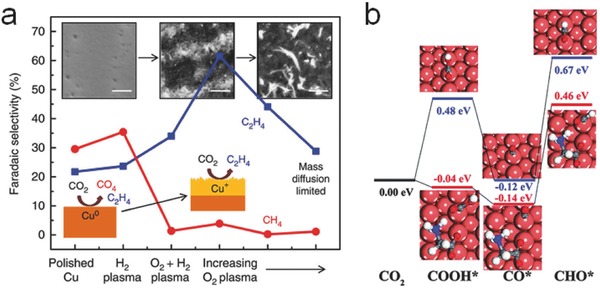
Figure 8.

a) Hydrocarbon selectivity of plasma‐treated Cu foils. Reproduced with permission.114 Copyright 2016, the Author, published under CC‐BY 4.0 license. b) The DFT calculated free energy change of CO2 and CO protonation without glycine (blue lines) and with glycine (red lines). Reproduced with permission.116 Copyright 2016, The Royal Society of Chemistry.
