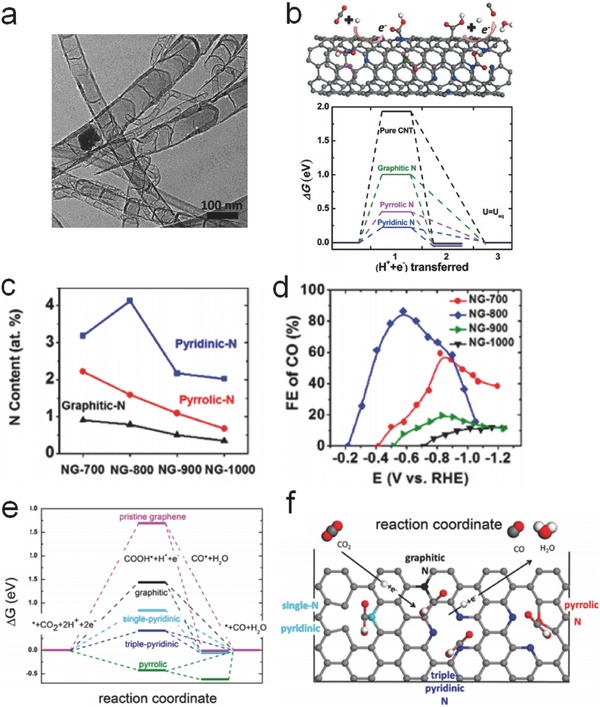
Figure 13.

a) TEM image of bamboo‐shaped NCNTs. b) Schematic of CO formation on NCNTs and free‐energy diagram at equilibrium potential for CO2 reduction on pyridinic‐N, pyrrolic‐N, and graphitic‐N defects compared to original CNTs. Reproduced with permission.144 c) The corresponding N functionality content and d) Faradaic efficiency of CO production versus applied potential on N‐doped graphene with different doping temperatures (700–1000 °C). e) Free energy diagrams of electrocatalytic CO2 conversion on N‐doped graphene and f) schematic of nitrogen defects and CO2 reduction mechanism. Reproduced with permission.150 Copyright 2015, American Chemical Society.
