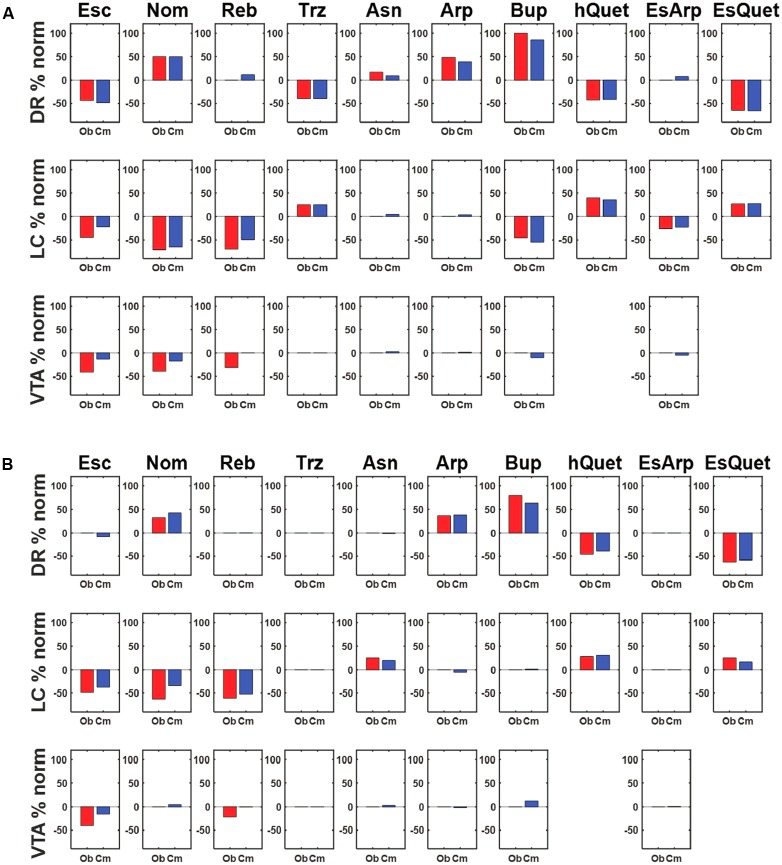
FIGURE 4.
Agreement between observed and simulated percentage activation changes following acute or chronic drug administration. (A) Each row shows the percentage change from normal activation of the DR, LC, and VTA units, respectively, due to acute administration of the drug(s) in each column. The red bar represents the empirical value observed by the Blier lab, while the blue bar represents the computational value produced by the model. The model is parameterized using the representative parameterization (RMS error is 9.93, see text). (B) Each row shows the percentage change from normal activation of the DR, LC, and VTA units, respectively, in response to chronic administration of the drug(s) in each column. The red bar represents the value observed by the Blier lab. The blue bar represents the computational value produced by the model, each selected from among many adaptation runs for its agreement with the data (different runs produced different activation patterns; see text). The RMS error between the observed and computational values at the chronic stage is 9.58. Abbreviations: Escitalopram, Esc; Nomifensine, Nom; Reboxetine, Reb; Trazodone, Trz; Asenapine, Asn; Aripiprazole, Arp; Bupropion, Bup; Quetiapine, hQuet; Escitalopram + Aripiprazole, EsArp; Escitalopram + Quetiapine, EsQuet.

