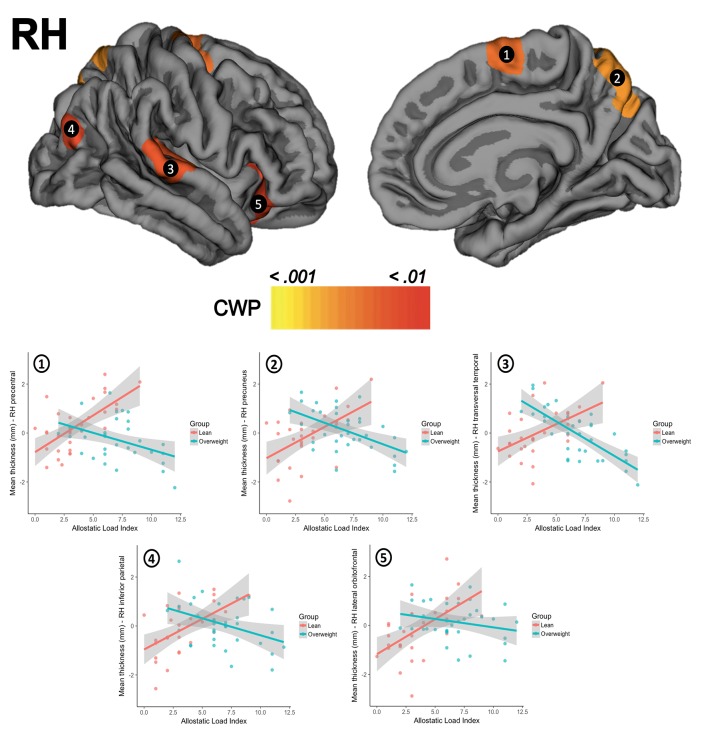
Figure 2.
The upper row shows the visual interactions between groups for clusters in the right hemisphere (RH) in (1) precentral gyrus, (2) precuneus, (3) transversal temporal gyrus, (4) inferior parietal cortex, and (5) lateral orbitofrontal cortex. The second row presents scatterplots of the interaction between groups (overweight/blue, lean/red) for the standardized residuals mean cortical thickness (Y-axis) and AL index (X-axis). CWP, cluster-wise corrected p-value.

