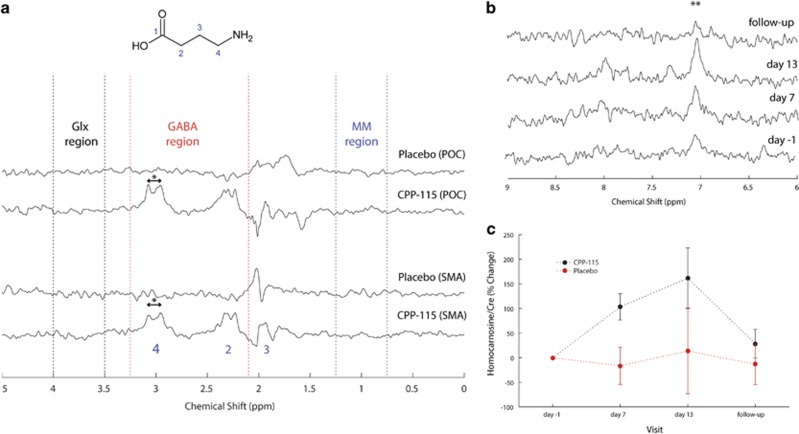
Figure 4.
(a) GABA-edited 1H MRS spectra reconstructed by subtracting the baseline (day −1) data from the day 13 data in individuals receiving either placebo (subject 2) or CPP-115 (subject 1). The top two rows correspond to data reconstructed for the POC and the bottom two rows are the corresponding reconstructed SMA data (see main text for details). The same vertical scaling was used for all spectra. The peak separation highlighted by ‘*’ is ∼0.128 p.p.m. (15.7 Hz). (b) Expanded regions of MEGA-PRESS on-resonance POC 1H MRS spectra recorded at all four scanning time points from a subject who had received CPP-115 for 14 days (subject 1). The symbol ‘**’ denotes the homocarnosine histidyl resonance at 7.05 p.p.m. (c) Group mean time courses for POC homocarnosine for both treatment groups with y axis showing the % change in homocarnosine/Cre compared with baseline. The error bars correspond to the calculated SE.

