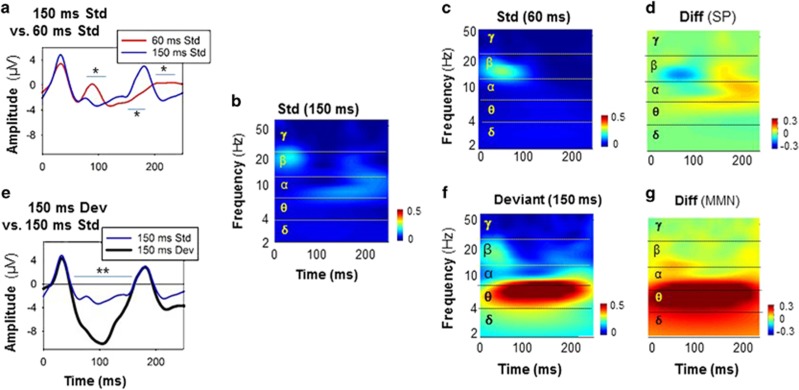
Figure 5.
Results of a control analysis evaluating the sensory response to 150 vs 60 ms standards (Std) and the potential relationship to mismatch negativity (MMN). For these experiments, complementary runs were collected with 150 ms deviants presented vs 60 ms standards in one run (10% sequential probability), and 60 ms deviants presented against 150 ms standards in a separate run. Comparisons were conducted both within and across runs. (a) Differential time-domain response, showing a longer sustained potential (SP) to the 150 vs 60 ms std. *p<0.05 and **p<0.01 for sequential significance (Guthrie and Buchwald, 1991). (b) Time–frequency plot of response to 150 ms standard stimulus, showing primary activity in the β- and α-frequency ranges. (c) Time–frequency plot of response to 60 ms standard, showing predominant activity in the β-range (compare to Figure 1b). (d) Difference (Diff) in time–frequency response to 150 vs 60 ms standards reflecting the SP. Note predominant differential activity in the β and α with limited differential activity in the θ-frequency band. (e) Differential time-domain response showing a significantly larger response to the 150 ms deviant vs standard in the 80–120 ms latency range. (f) Time–frequency response to 150 ms duration stimuli presented as deviants against 60 ms standards. (g) Diff in time–frequency response to 150 ms deviants minus 150 ms standards, showing prominent difference in the θ-frequency band. No different scales for responses to standard and deviant stimuli (b, c, f) vs difference panels (d, g).

