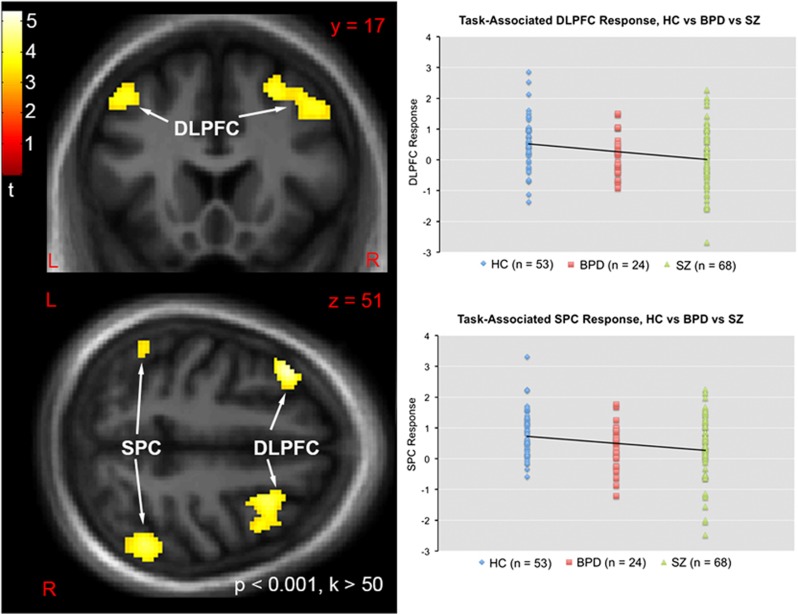
Figure 2.
Left: Statistical parametric t map of task-associated BOLD response demonstrating significant linear trends (HC>BPD>SZ directional contrast) on DLPFC and SPC signal. Map masked by a whole brain gray matter mask and thresholded at whole-brain voxelwise p<0.001, k>50 voxels for visualization purposes. Map displayed in the neurologic convention (R on R). Top Right: Plot of individual task-associated BOLD response (beta weights) within the bilateral DLPFC ROI for each diagnostic group. Straight line represents the slope of the linear contrast HC>BPD>SZ. Bottom Right: Plot of task-associated BOLD response (beta weights) within the bilateral SPC ROI for each diagnostic group. Straight line represents the slope of the linear contrast HC>BPD>SZ.

