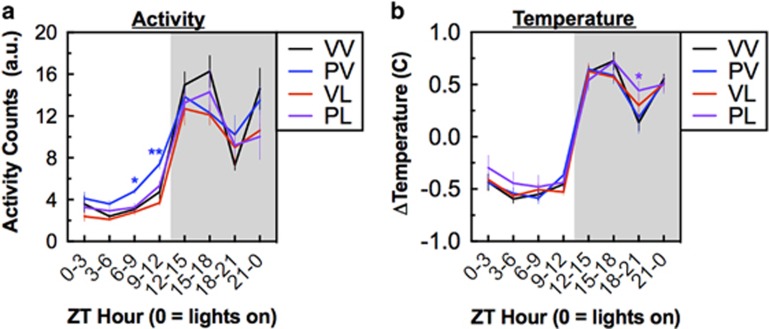
Figure 2.
Treatment effects on circadian rhythms at week 7–8; data consolidated into 3-h time bins and averaged over a 7-day period (means±SEM). (a) Activity counts were lower during the dark phase in mice in the PV, VL, and PL treatment groups. (b) Relative temperature was higher during the dark phase in the PL treatment group. *P<0.05, **P<0.01, compared with VV, Dunnett’s post hoc tests.

