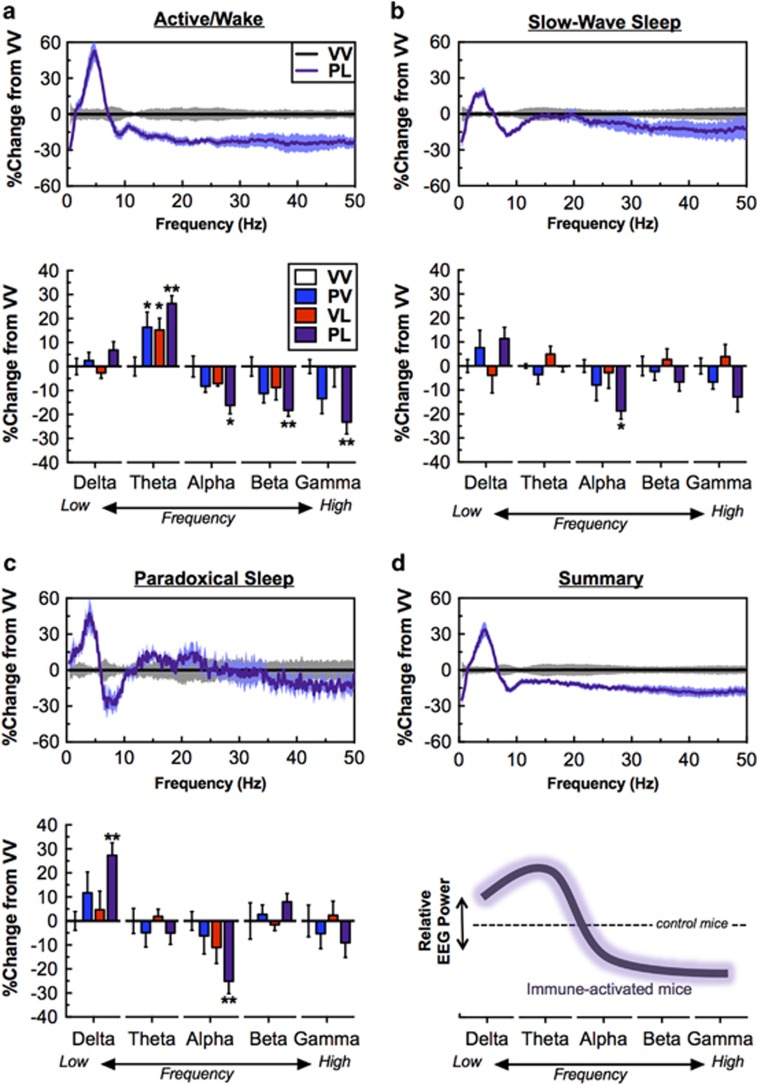
Figure 4.
Treatment effects on EEG spectral power; data are consolidated over a 24-h period in 10-s epochs. For clarity, only PL-treatment mice are presented in the top panel, as effects were seen only in this group. Bottom panels show relative power bands of Delta (0.5–4 Hz), Theta (4–8 Hz), Alpha (8–12 Hz), Beta (16–24 Hz) and low Gamma (30–50 Hz), all normalized to VV-treated mice. (a, top/bottom) during active/wake, Theta power was higher but Alpha, Beta, and low Gamma power was lower in PL-treated mice. (b, top/bottom) During slow wave sleep (SWS), Alpha power was lower in PL-treated mice. (c) During paradoxical sleep, Delta was higher and Theta power was lower in PL-treated mice. (d) Simplified depiction of the general ‘signature’ of PL treatment on EEG spectral power. *P<0.05, **P<0.01 compared with VV, Dunnett’s post hoc tests.

