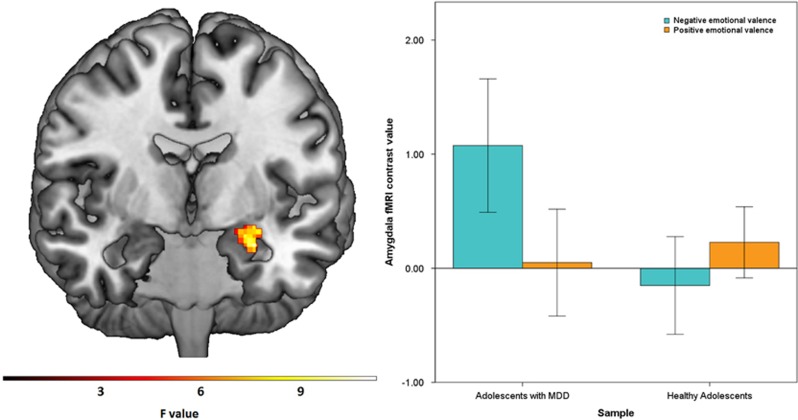
Figure 1.
Coronal view (Montreal-Neurological-Institute coordinate y=−3) depicts the interaction effect of group (MDD versus HC) by condition (positive vs negative) within the amygdala (F(1, 68)=11.24, TFCE=709.89, k=5, PFWE=0.027), resulting from an increased amygdala activity in reaction to negative faces (T(34)=3.48, TFCE=65.62, k=12, PFWE=0.012) and a decreased amygdala activity to positive faces (T(34)=3.53, TFCE=48.13, k=34, PFWE=0.001) in adolescents with MDD compared to HC. For display reasons, the statistical threshold was set to P<0.05, uncorrected. Right: bar graphs depicting the estimated contrast values of the amygdala subdivided by group (MDD, HC) for the negative emotional valence (blue) and the positive emotion valence (orange) condition. Error bars (±2 SE). MDD, major depressive disorder; HC, healthy controls. A full color version of this figure is available at the Neuropsychopharmacology journal online.

